Calculating and Plotting a Phase Diagram
This topic describes how to calculate a phase diagram in the POLY module.
POLY Module Commands and POST Module Commands
- Calculate an initial equilibrium in the POLY module.
-
Use SET_AXIS_VARIABLE to set the first axis variable, its minimum and maximum mapping value and the length of each incremental step on this axis. The first parameter of SET_AXIS_VARIABLE is the axis number and is set to 1. For example, suppose you want the mass fraction of C as your first axis variable. You want it to vary between 0 and 0.1, with the length of each incremental step being no more than 0.002. Then enter:
SET_AXIS_VARIABLE 1 W(C) 0 .1 0.002
An axis variable must be a state variable that is set when you calculated the initial equilibrium. For example, if you set the fraction of a component in number of moles, then you cannot set the mass fraction of this component as an axis variable.
-
Use SET_AXIS_VARIABLE to set the second axis variable and specify its minimum, maximum, and step length values. The axis number is set to 2. For example, suppose you want temperature as your second axis variable and you want it to vary between 900 K and 1900 K, with an incremental step of 25 K. Then enter:
SET_AXIS_VARIABLE 2 T 900 1900 25
-
If you want more than two axis variables, then use SET_AXIS_VARIABLE until you have set all the axis variables. You can set up to five axis variables. Axis variables 3, 4 and 5 must be set temperature, pressure or to the chemical potentials of components.
You may want to save your workspace with SAVE_WORKSPACES before you perform the mapping calculation. This saves the axis variables you have set. However, it overwrites the results of any previous stepping or mapping calculations done.
-
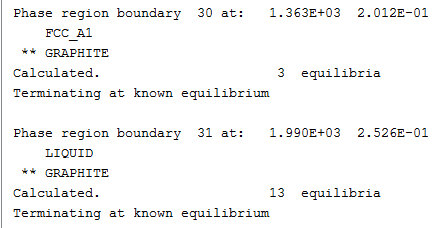
Use MAP to perform the mapping calculation. The console lists the phase region boundaries and the phases contained on one side of each boundary.
- To plot the diagram, use POST to open the POST module and then use PLOT_DIAGRAM. By default, the X-axis represents mapping axis variable 1 and the Y-axis represents mapping axis variable 2.
