Calculating and Plotting a Property Diagram
This topic explains how to calculate a property diagram in POLY. To calculate a property diagram means to calculate a series of equilibria while the value of the stepping axis variable varies between a minimum and a maximum value. With the exception of the stepping axis variable, all the state variables that you set when you calculate the initial equilibrium retain the values when the new equilibria are calculated.
- Calculate an initial equilibrium in the POLY module.
-
Use SET_AXIS_VARIABLE to set the axis variable, the minimum and the maximum stepping variable values and the step length. The first parameter of set_axis_variable is the axis number. Since a property diagram only has one axis variable, this is set to 1. For example, if you want to set the axis variable to temperature, and calculate an equilibrium at every 50 K between a minimum temperature of 100 K and a maximum temperature of 2000 K, enter
SET_AXIS_VARIABLE 1 T 100 2000 50
An axis variable must be a state variable that is set when you calculated the initial equilibrium. For example, if you set the fraction of a component in number of moles, then you cannot set the mass fraction of this component as an axis variable. Also, the minimum stepping variable value must be smaller than, and the maximum value larger than, the value that you set the state variable to when calculating the initial equilibrium.
-
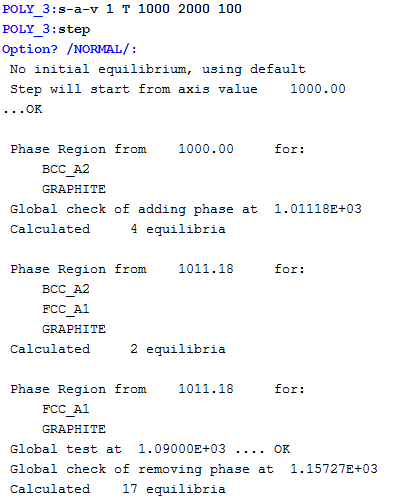
Use STEP_WITH_OPTIONS and choose
Normalto perform the stepping operation.The phase regions are listed along the stepping axis, the phases contained in each region, and the number of equilibria calculated in that region. Each region is defined by the phases it contains.
The number of equilibria calculated is not just the number of steps that are performed according to the step length and the minimum and maximum values on the axis variable. This is because Thermo‑Calc calculates extra equilibria when a new phase is discovered in order to determine the phase region boundary more precisely.
- To plot the diagram, open the POST module and then use PLOT_DIAGRAM. By default, the X-axis represents the stepping axis variable and Y-axis represents the sum of the mole fractions of all phases (NP(*)).
