Effect of Alloying Elements on Phase Stability
The TCS Mo-based Alloys Database (TCMO) can be used to examine the effect of alloying elements on phase stability.
Ti, Zr, and Hf are potential BCC stabilizers for the Mo-Si-B based alloys. It is important to have a better understanding of how these alter the phase equilibria among the three base phases (BCC, T2, and Mo3Si) and how it introduces new phases.
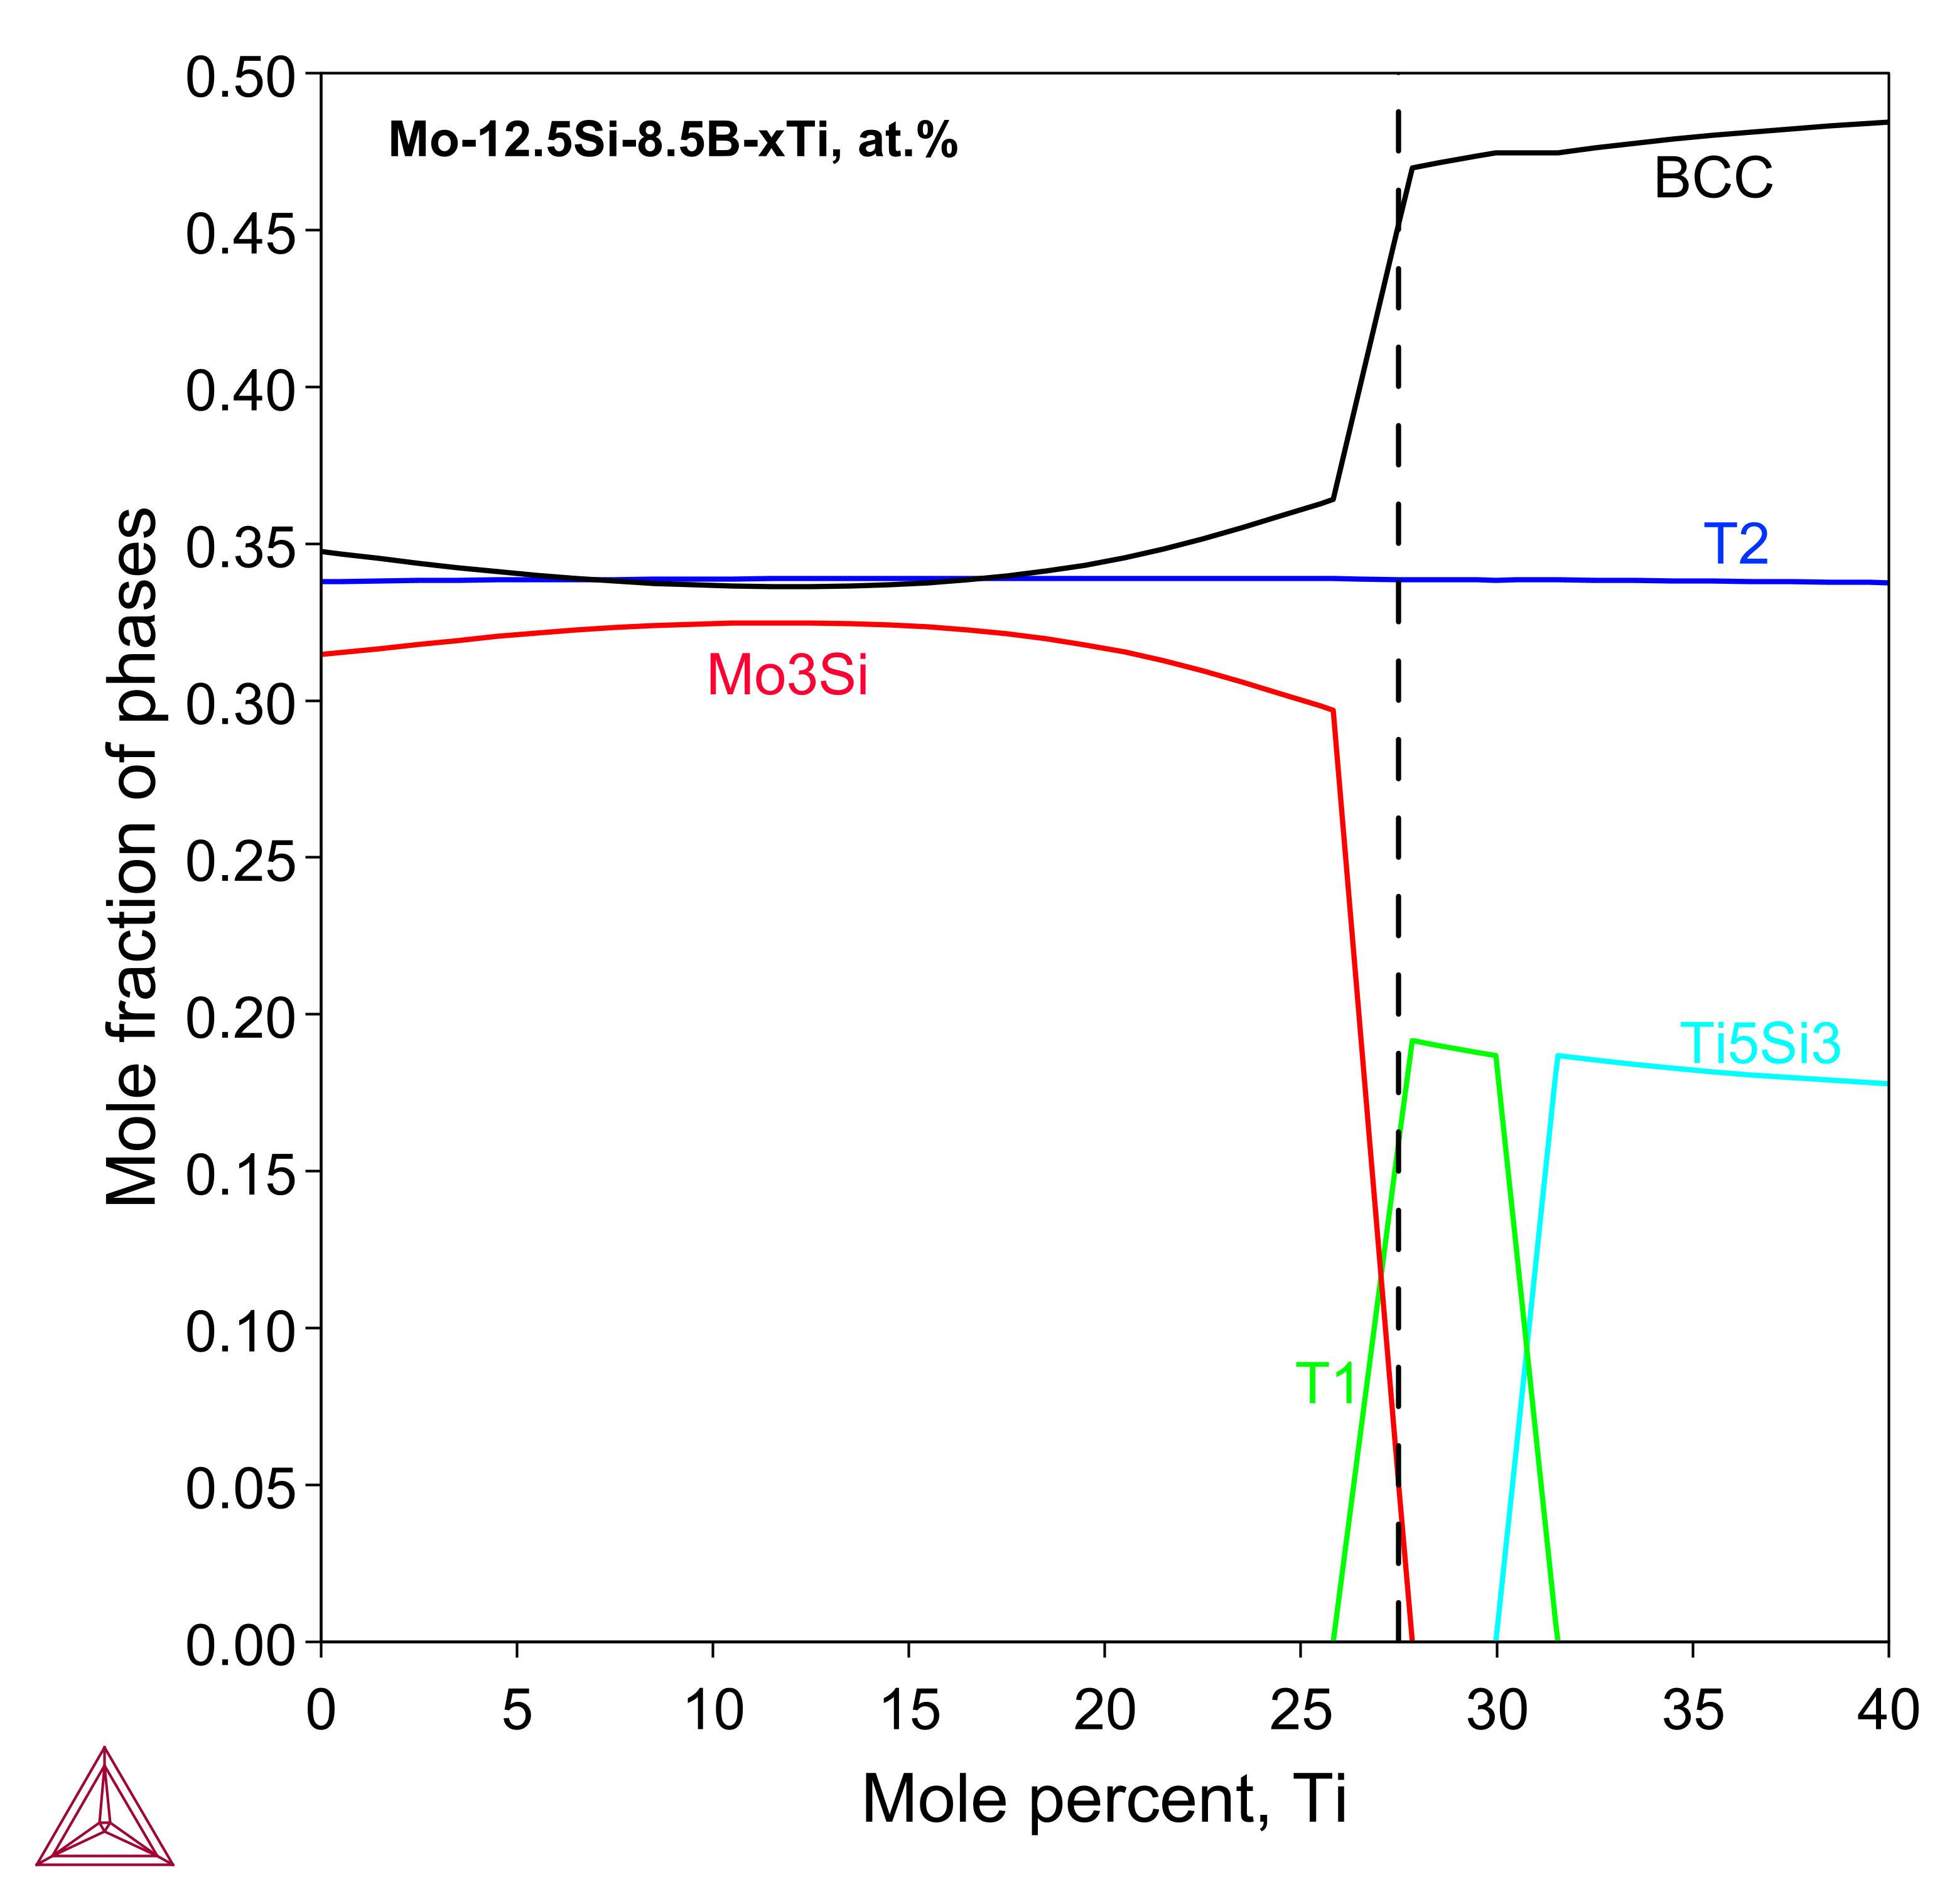
Figure 1 indicates that at 1600 °C the addition of Ti to the base composition Mo-12.5Si-8.5B (at.%) stabilizes BCC and T1 at the expense of Mo3Si. When Ti content exceeds 30 at.%, the Ti5Si3 phase starts to form at the expense of the T1 phase. The calculated phase compositions for the Mo-12.5Si-8.5B-27.5Ti (at.%) alloy are consistent with the experimental measurements from [2010Yan].
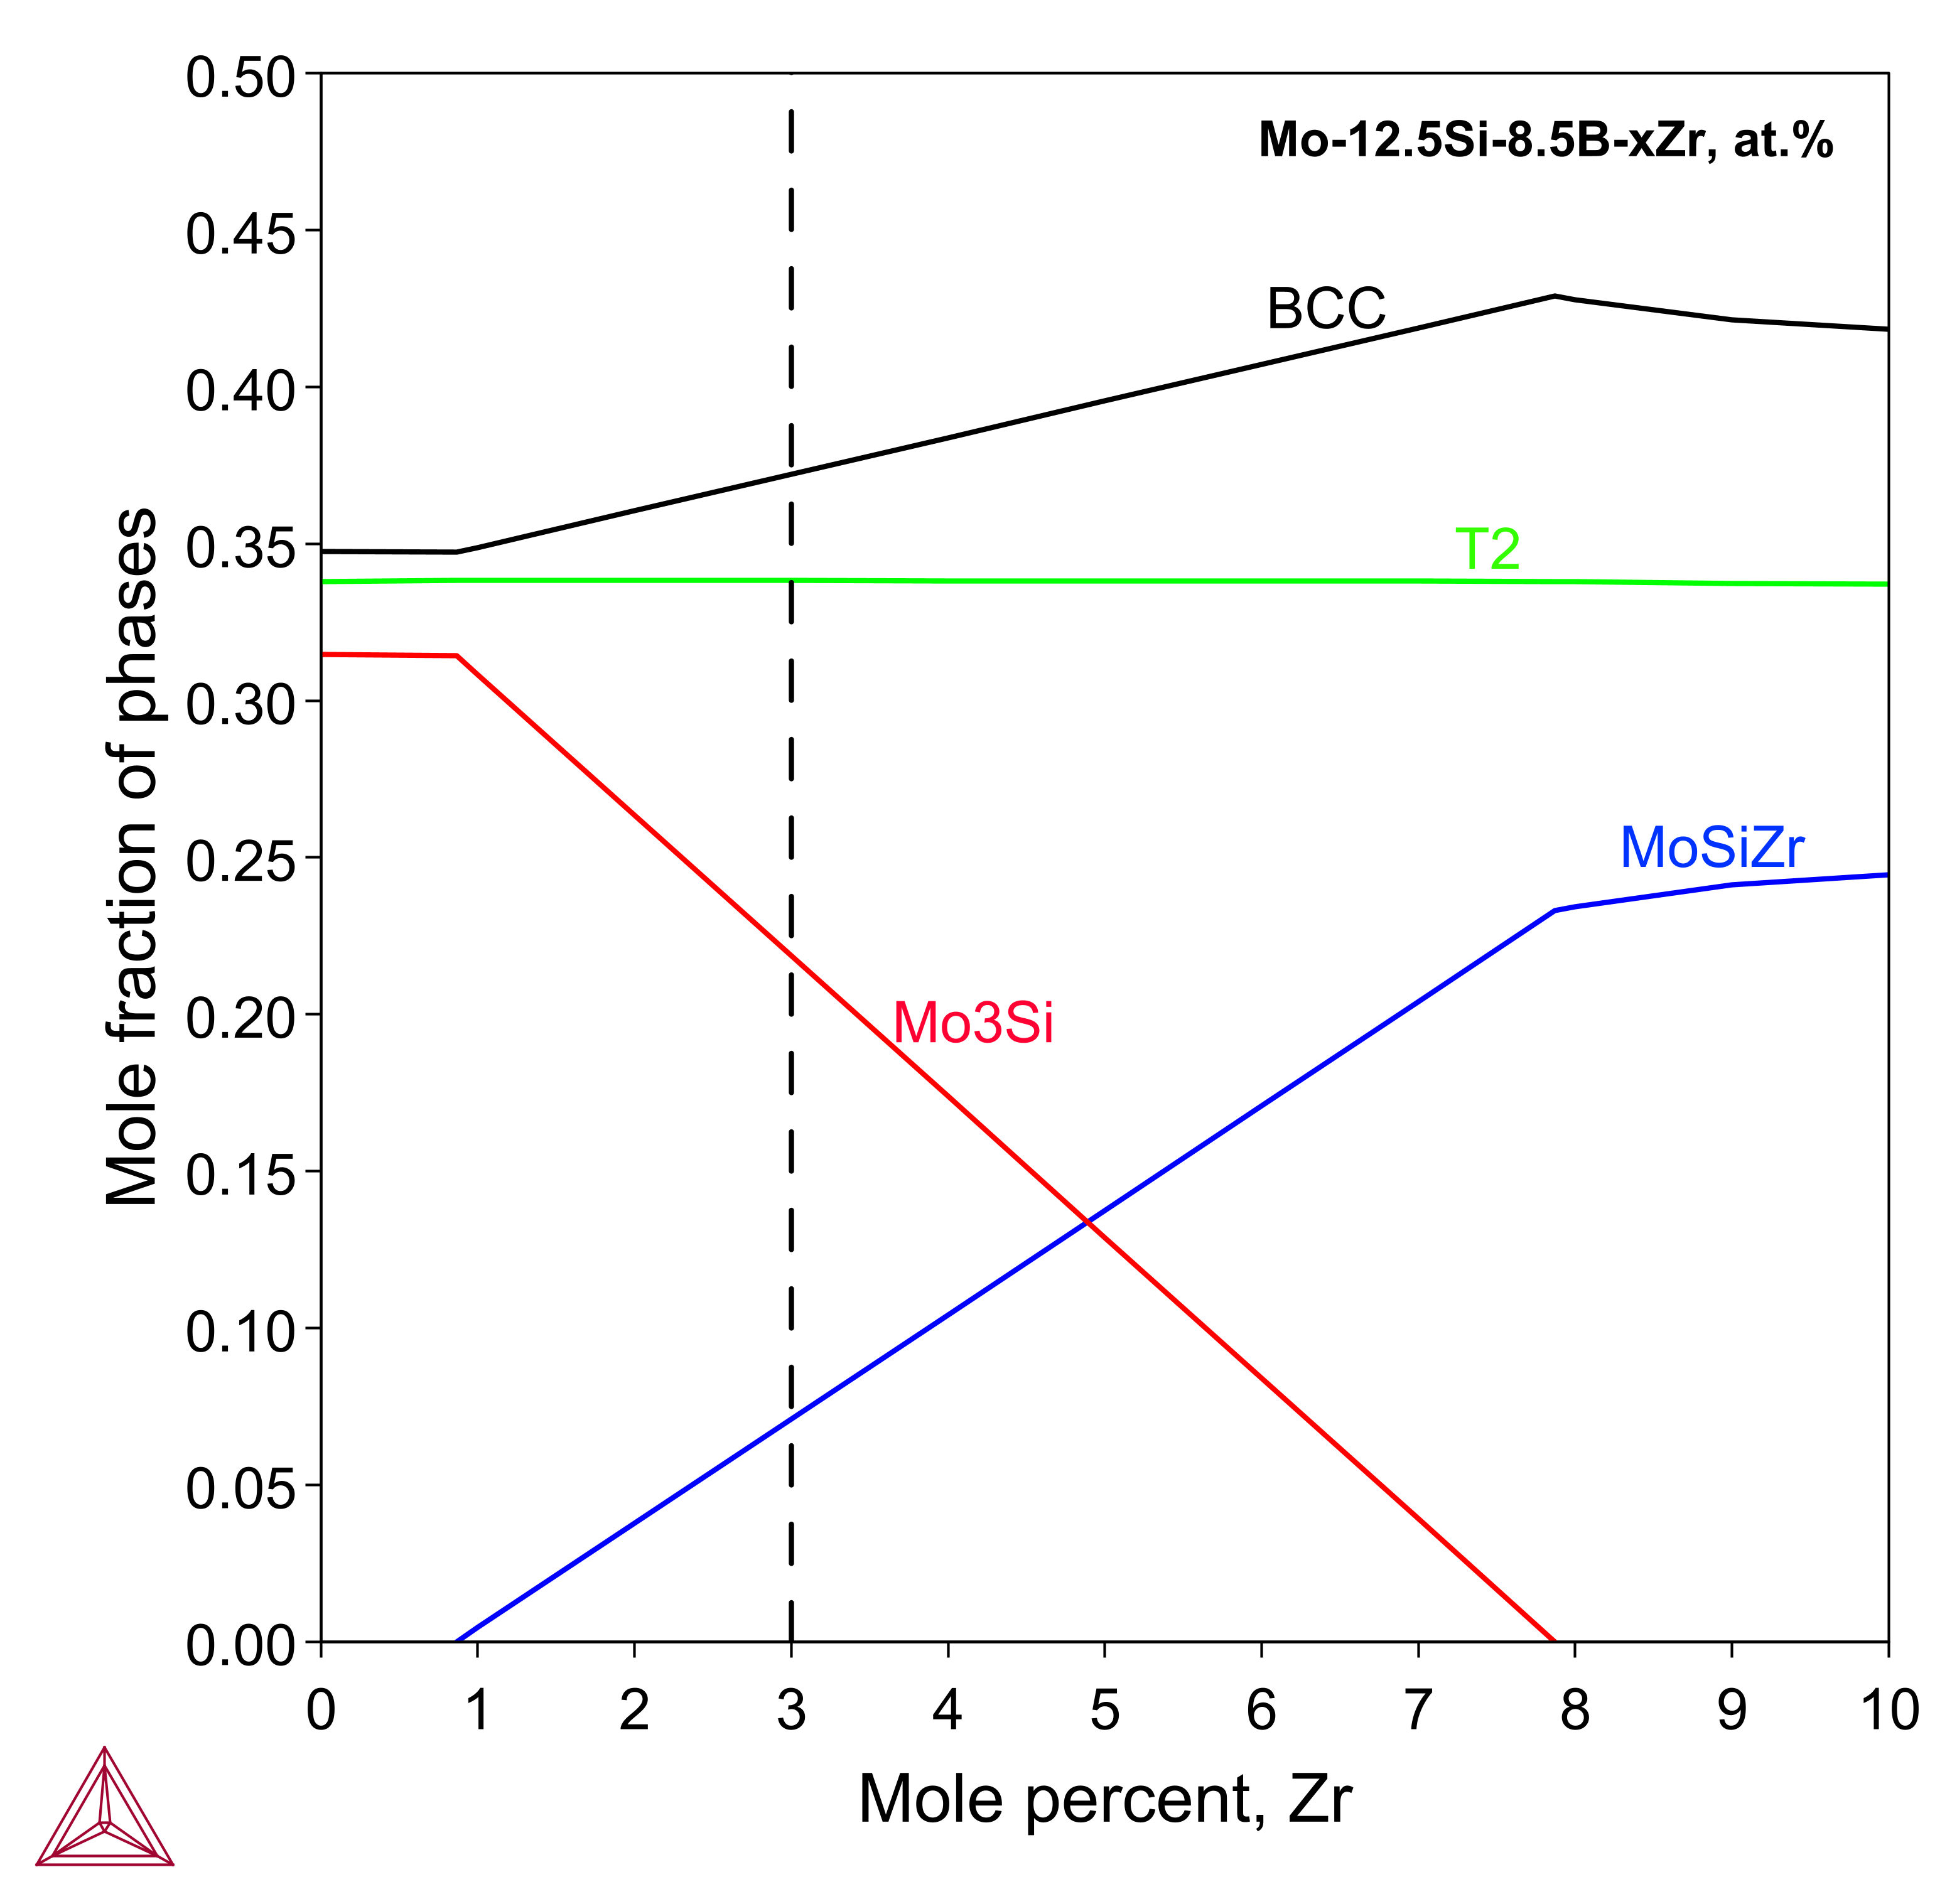
By contrast, Figure 2 shows that the introduction of Zr to the Mo-12.5Si-8.5B (at.%) alloy leads to the formation of the MoSiZr phase. The calculated phase compositions for the Mo-12.5Si-8.5B-3Zr (at.%) alloy agree well with the experimental measurements from [2010Yan].
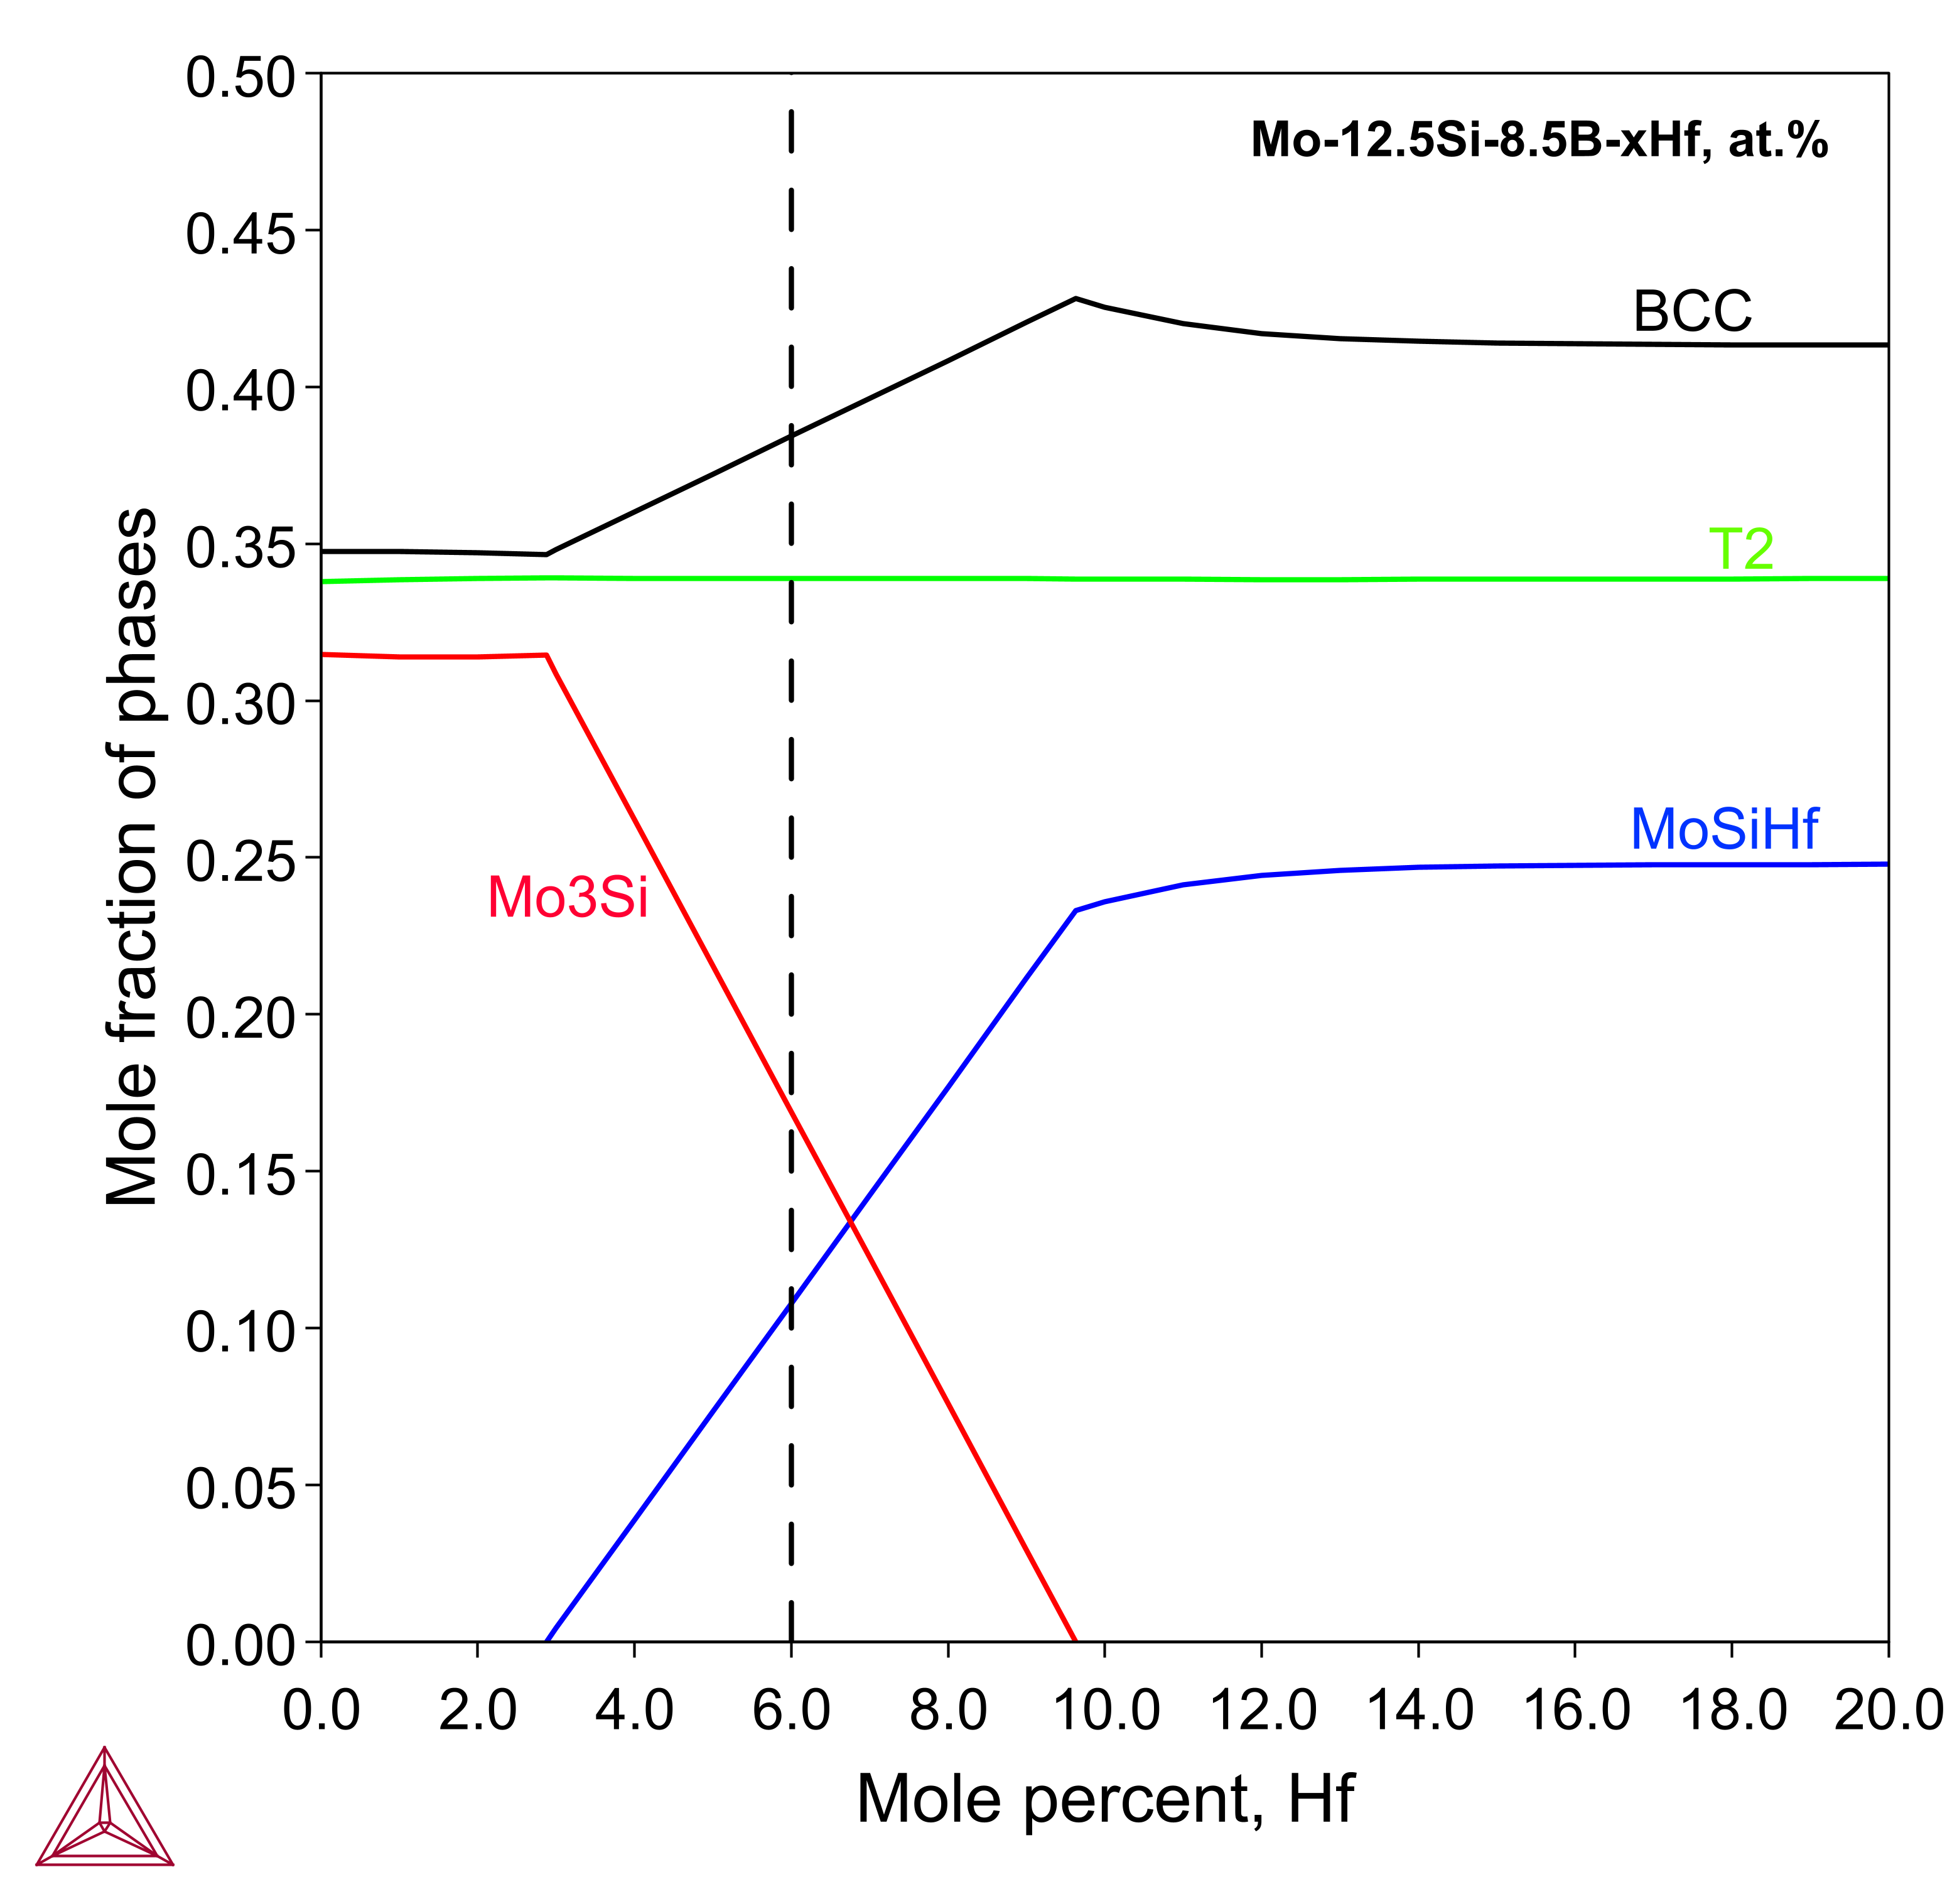
Similarly, Hf also results in the appearance of the MoSiHf phase as shown in Figure 3. The calculated phase compositions for the Mo-12.5Si-8.5B-6Hf (at.%) alloy are in good accordance with the experimental measurements from [2010Yan].
Mo-Si-B-Ti
Figure 1: Calculated phase fractions as a function of Ti concentration in the Mo-12.5Si-8.5B-xTi (at.%) alloys at 1600 °C. The dashed line marks the experimentally investigated composition where x = 27.5.
Calculated phase compositions for the Mo-12.5Si-8.5B-27.5Ti (at.%) alloy at 1600 °C compared with experimental data from [2010Yan].
| Phase | BCC, at.% | Mo3Si, at.% | T2, at.% | T1, at.% | ||||
|---|---|---|---|---|---|---|---|---|
| Exp. | Calc. | Exp. | Calc. | Exp. | Calc. | Exp. | Calc. | |
| Mo | 69.5 | 73.5 | 47.7 | 47.8 | 35.0 | 36.1 | 24.6 | 23.1 |
| Ti | 24.5 | 24.1 | 29.9 | 27.2 | 29.0 | 26.4 | 38.7 | 39.4 |
| Si | 2.3 | 2.3 | 22.4 | 25.0 | 13.5 | 12.5 | 36.7 | 37.5 |
| B | 3.7* | 0.1 | ~0* | 0 | 22.5* | 25.0 | ~0* | 0 |
| * B content was not accurately measured in the experiment | ||||||||
Mo-Si-B-Zr
Figure 2: Calculated phase fractions as a function of Zr concentration in the Mo-12.5Si-8.5B-xZr (at.%) alloys at 1600 °C. The dashed line marks the experimentally investigated composition where x = 3.
Calculated phase compositions for the Mo-12.5Si-8.5B-3Zr (at.%) alloy at 1600 °C compared with experimental data from [2010Yan].
| Phase | BCC, at.% | Mo3Si, at.% | T2, at.% | T1, at.% | ||||
|---|---|---|---|---|---|---|---|---|
| Exp. | Calc. | Exp. | Calc. | Exp. | Calc. | Exp. | Calc. | |
| Mo | 90.0 | 98.6 | 74.0 | 74.5 | 58.0 | 60.5 | 36.4 | 36.0 |
| Zr | 0.3 | 0.1 | 0.5 | 0.5 | 2.0 | 2.0 | 31.3 | 30.7 |
| Si | 3.0 | 1.2 | 24.5 | 25.0 | 12.0 | 12.5 | 32.4 | 33.3 |
| B | 6.7* | 0.1 | ~0* | 0 | 28.0* | 25.0 | ~0* | 0 |
| * B content was not accurately measured in the experiment | ||||||||
Mo-Si-B-Hf
Figure 3: Calculated phase fractions as a function of Hf concentration in the Mo-12.5Si-8.5B-xHf (at.%) alloys at 1600 °C. The dashed line marks the experimentally investigated composition where x = 6.
Calculated phase compositions for the Mo-12.5Si-8.5B-6Hf (at.%) alloy at 1600 °C compared with experimental data from [2010Yan].
| Phase | BCC, at.% | Mo3Si, at.% | T2, at.% | T1, at.% | ||||
|---|---|---|---|---|---|---|---|---|
| Exp. | Calc. | Exp. | Calc. | Exp. | Calc. | Exp. | Calc. | |
| Mo | 88.0 | 98.6 | 74.0 | 73.6 | 57.0 | 55.4 | 35.0 | 35.9 |
| Hf | 1.4 | 0.1 | 1.3 | 1.4 | 7.0 | 7.1 | 30.5 | 30.8 |
| Si | 3.1 | 1.2 | 24.7 | 25.0 | 14.0 | 12.5 | 34.5 | 33.3 |
| B | 7.5* | 0.1 | ~0* | 0 | 22.0* | 25.0 | ~0* | 0 |
| * B content was not accurately measured in the experiment | ||||||||
Reference
[2010Yan] Y. Yang, H. Bei, S. Chen, E. P. George, J. Tiley, Y. A. Chang, Effects of Ti, Zr, and Hf on the phase stability of Mo_ss + Mo3Si + Mo5SiB2 alloys at 1600°C. Acta Mater. 58, 541–548 (2010).


