Phase Stability Predictions
The TCS Permanent Magnetic Materials Database (TCPMAG) can be used to calculate phase equilibria, including phase fractions and compositions, to reliably account for phase transformations. All the stable solution phases and intermetallic compounds that exist in the assessed and their extrapolated systems are included in the current database.
TCPMAG2 is able to predict the stable phases for a given composition and condition within the recommended composition range of the database.
Ce-Nd-Fe-B
The table below shows the calculated phases in (Ce1-xNdx)16Fe78B6 alloys compared with experimentally determined ones. TCPMAG2 is able to predict the phase types at each given composition correctly and predict the transition from Fe2Re to ReFe4B4 (T2) phase at around x=0.5-0.6. In the table, GB is the grain boundary phases.
|
|
x=0 |
x=0.1 |
x=0.2 |
x=0.3 |
x=0.4 |
x=0.5 |
x=0.6 |
x=0.7 |
|---|---|---|---|---|---|---|---|---|
|
Exp. from [2017Zha] |
Re2Fe14B Fe2Re GB |
Re2Fe14B Fe2Re GB |
Re2Fe14B Fe2Re GB |
Re2Fe14B Fe2Re GB |
Re2Fe14B Fe2Re GB |
Re2Fe14B Fe2Re GB |
Re2Fe14B ReFe4B4 GB |
Re2Fe14B ReFe4B4 GB |
|
Cal. |
Re2Fe14B Fe2Re ReFe4B4 |
Re2Fe14B Fe2Re ReFe4B4 |
Re2Fe14B Fe2Re ReFe4B4 |
Re2Fe14B Fe2Re ReFe4B4 |
Re2Fe14B Fe2Re ReFe4B4 |
Re2Fe14B Fe2Re ReFe4B4 Dhcp |
Re2Fe14B ReFe4B4 Dhcp |
Re2Fe14B ReFe4B4 Dhcp |
Ce-Co-Fe-B
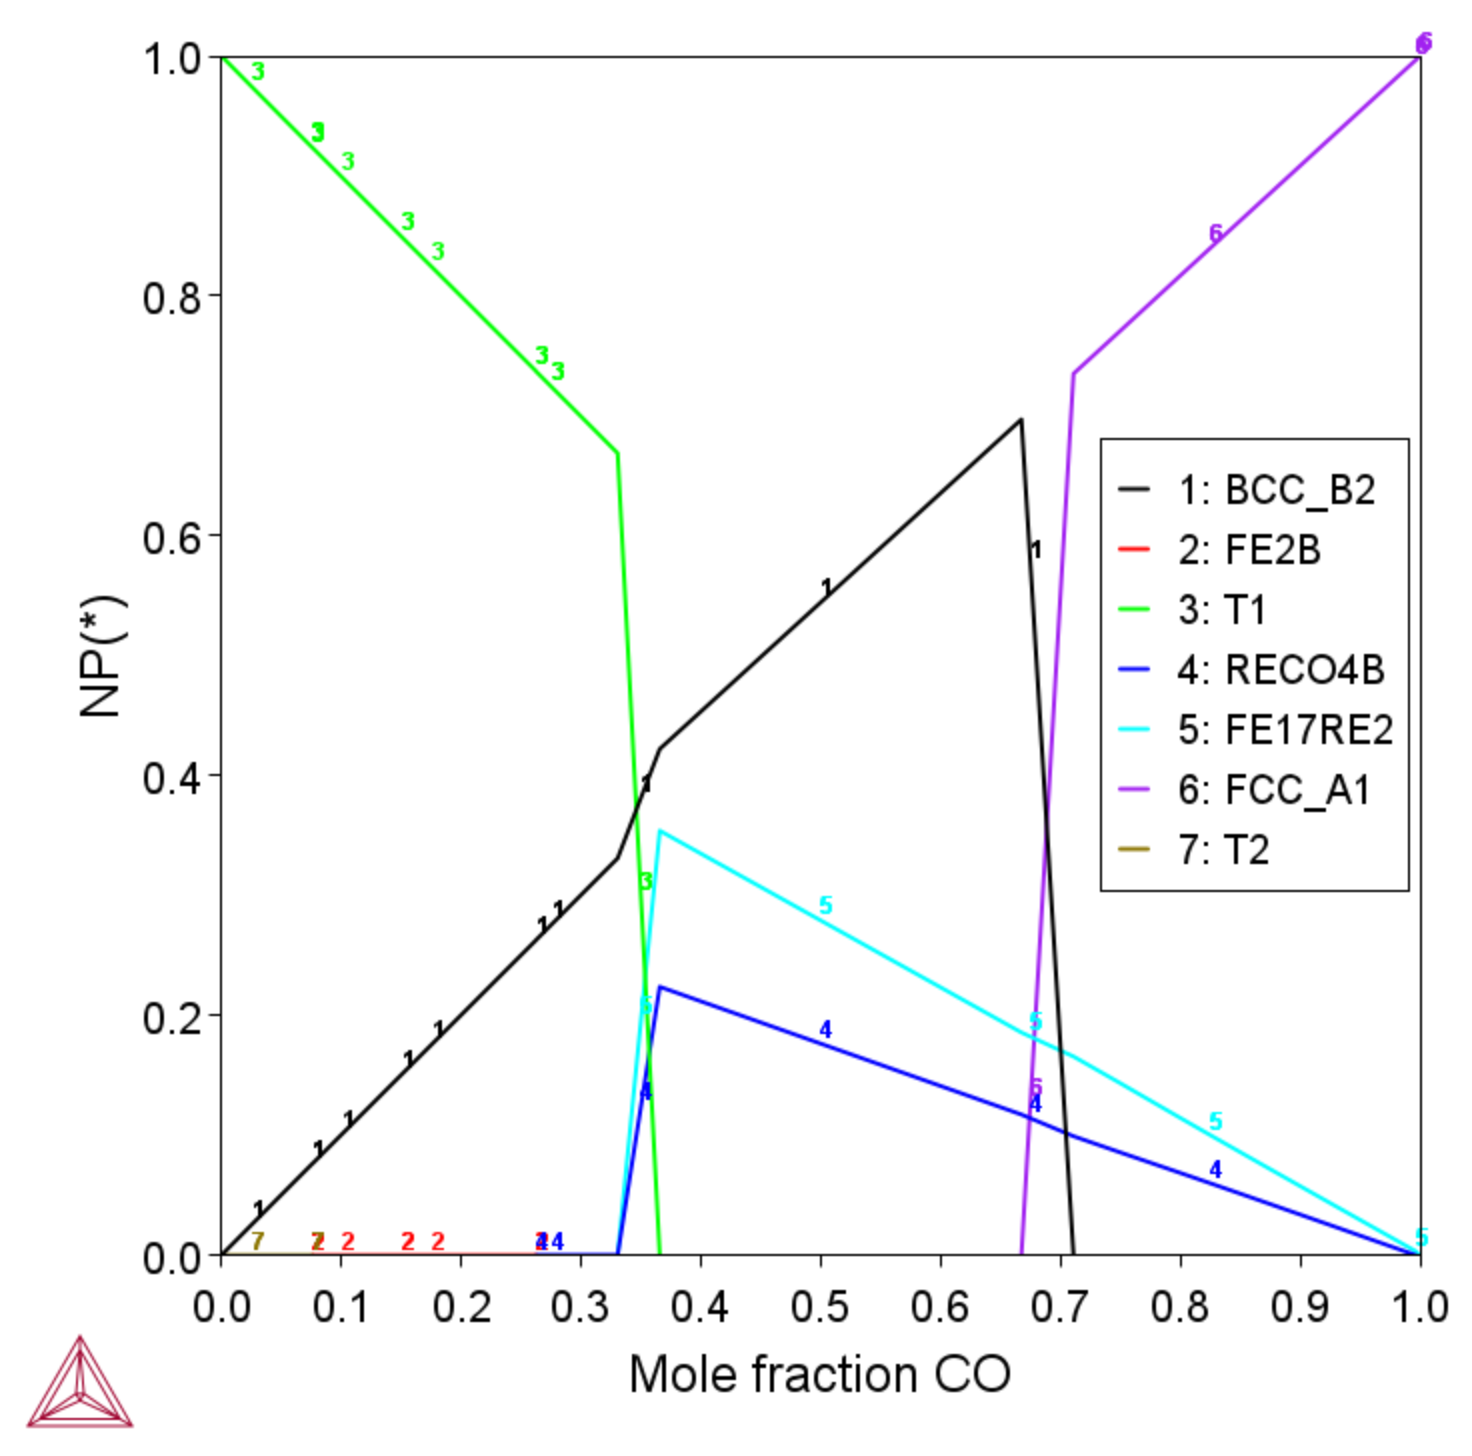
To understand the phase equilibria and explore promising magnetic phases, Wang et al. [2016Wan] studied the Ce-Co-Fe-B diffusion couples and key alloys at 900 °C by SEM/WDS and XRD. Three magnetic phases Ce2(Co,Fe)14B (T1), CeCo4B and Ce3(Co,Fe)11B4 were determined. In this example, the step diagram for Ce2Fe14B-Co and phase equilibrium calculations were made to compare with the experimental results on diffusion couple and key alloys.
For Ce2Fe14B-Co, with increasing Co content, the stable phases changing from T1 to T1+BCC → BCC+Fe17Re2+ReCo4B → FCC+ReCo4B+Fe17Re2 and reach the FCC phase at Co end.
The following table shows the calculated phase equilibrium at 900 °C on the key alloys compared with the experimental results from [2016Wan].
|
Comparison A |
Phase Name |
Composition (mol%) |
|||
|
Ce |
Fe |
Co |
B |
||
| Nominal | 15 | 66 | 12 | 7 | |
| Exp. | T1 | 12 | 71 | 11 | 6 |
| ReCo4B | 16 | 54 | 15 | 15 | |
| Fe2Re | 36 | 41 | 23 | 0 | |
| Calc. | T1 | 11.8 | 70.8 | 11.5 | 5.9 |
| ReCo4B | 16.7 | 48.4 | 18.3 | 16.7 | |
| Fe2Re | 33.3 | 49.9 | 16.8 | 0 | |
| T2 | 12.2 | 43.9 | 0 | 43.9 | |
|
Comparison B |
Phase Name |
Composition (mol%) |
|||
|
Ce |
Fe |
Co |
B |
||
| Nominal | 12 | 32 | 50 | 6 | |
| Exp. | Fe17Re2 | 11 | 37 | 52 | 0 |
| ReCo4B | 17 | 13 | 54 | 16 | |
| BCC | 0 | 57 | 43 | 0 | |
| Calc. | Fe17Re2 | 10.5 | 38.1 | 51.4 | 0 |
| ReCo4B | 16.7 | 17.3 | 49.4 | 16.7 | |
| BCC | 0 | 57.9 | 42.1 | 0 | |
Dy-Fe-Nd-B
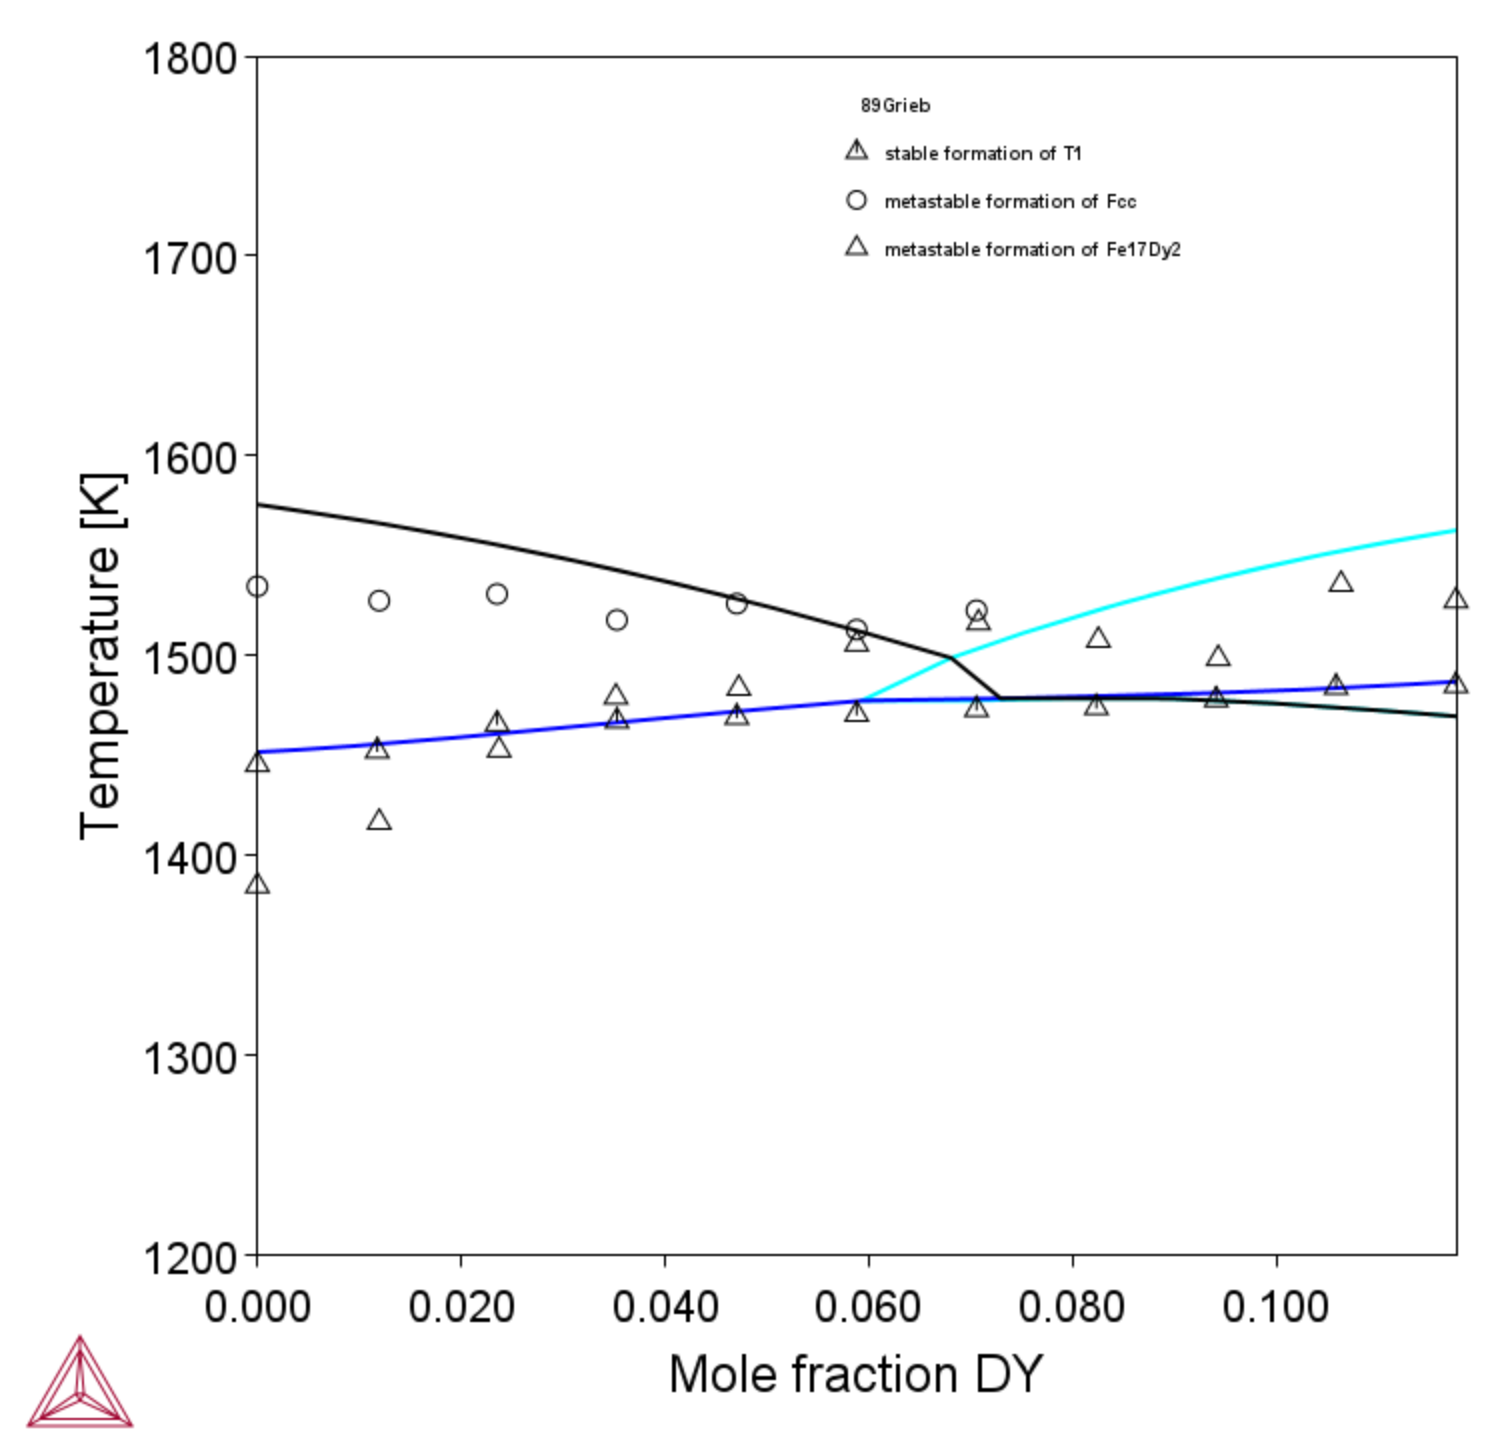
The following figure shows the calculated Nd2Fe14B-Dy2Fe14B isopleth compared with the one investigated by Grieb et al. [1989Gri] by means of metallography, XRD and DTA. They reported unlimited solid solubility above 800 °C for T1 phase (Dy,Nd)2Fe14B and on the increasing temperatures of formation measured. According to the authors, there is stable peritectic formation of Fe + L = T1 on the Nd-rich side and the stable peritectic formation Dy2Fe17 + L = T1 on the Dy-rich side.
References
[1989Gri] B. Grieb, G. Schneider, E.-T. Henig, G. Petzow, Structural Investigations and Constitution along Fe 14 (Nd 1-x (Tb or Dy) x ) 2 B. Int. J. Mater. Res. 80, 515–519 (1989).
[2016Wan] T. Wang, D. Kevorkov, M. Medraj, Phase Equilibria and Magnetic Phases in the Ce-Fe-Co-B System. Materials (Basel). 10, 16 (2016).
[2017Zha] L. Z. Zhao, H. Y. Yu, W. T. Guo, J. S. Zhang, Z. Y. Zhang, M. Hussain, Z. W. Liu, J. M. Greneche, Phase and Hyperfine Structures of Melt-spun Nanocrystalline (Ce 1–x Nd x ) 16 Fe 78 B 6 Alloys. IEEE Trans. Magn. 53, 1–5 (2017).

