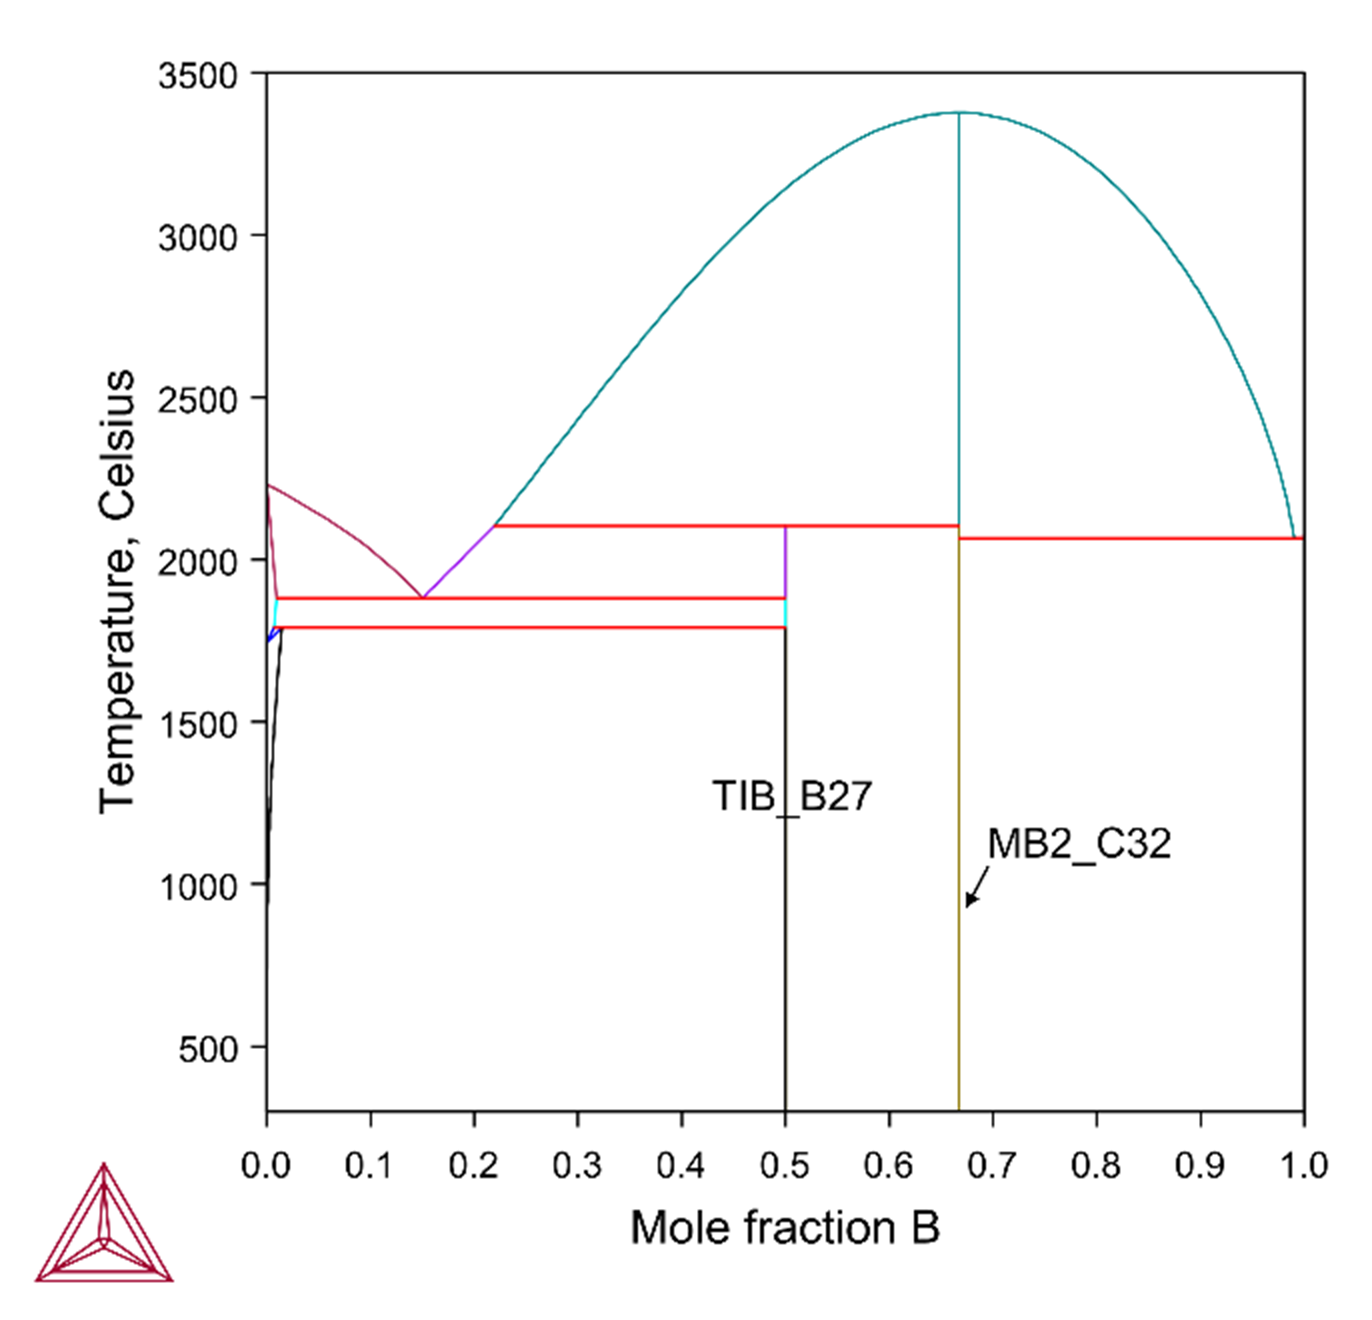
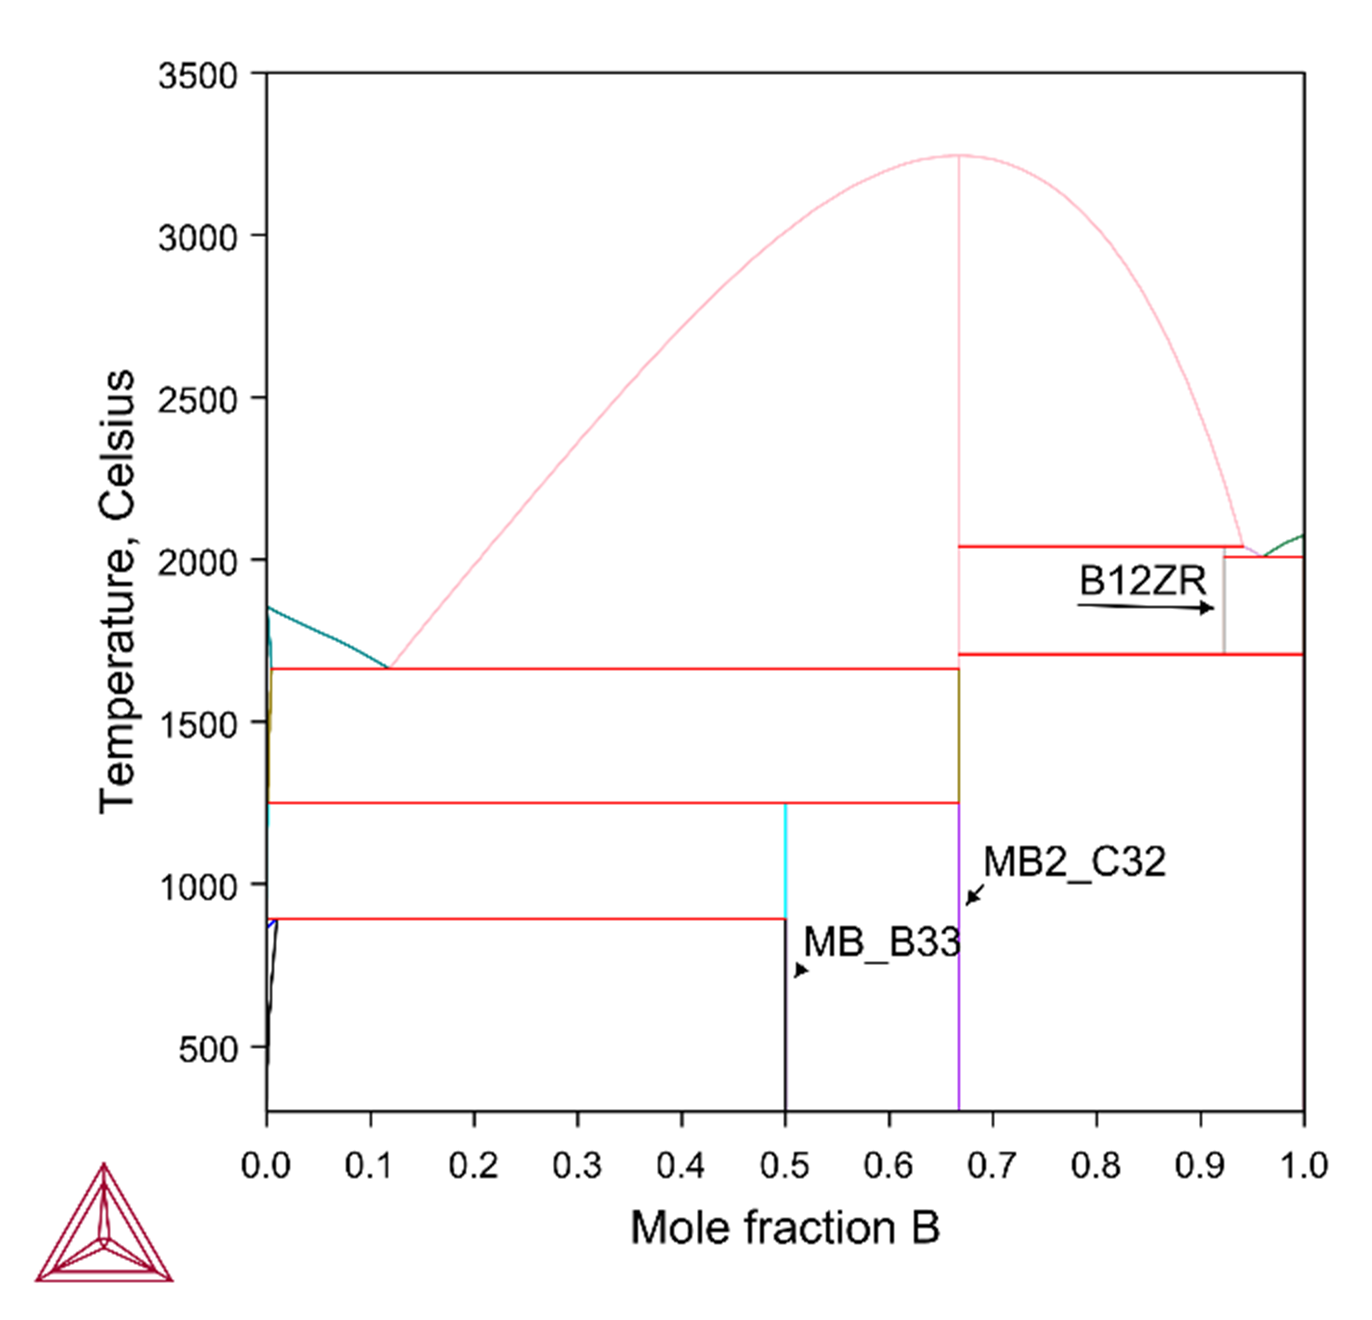
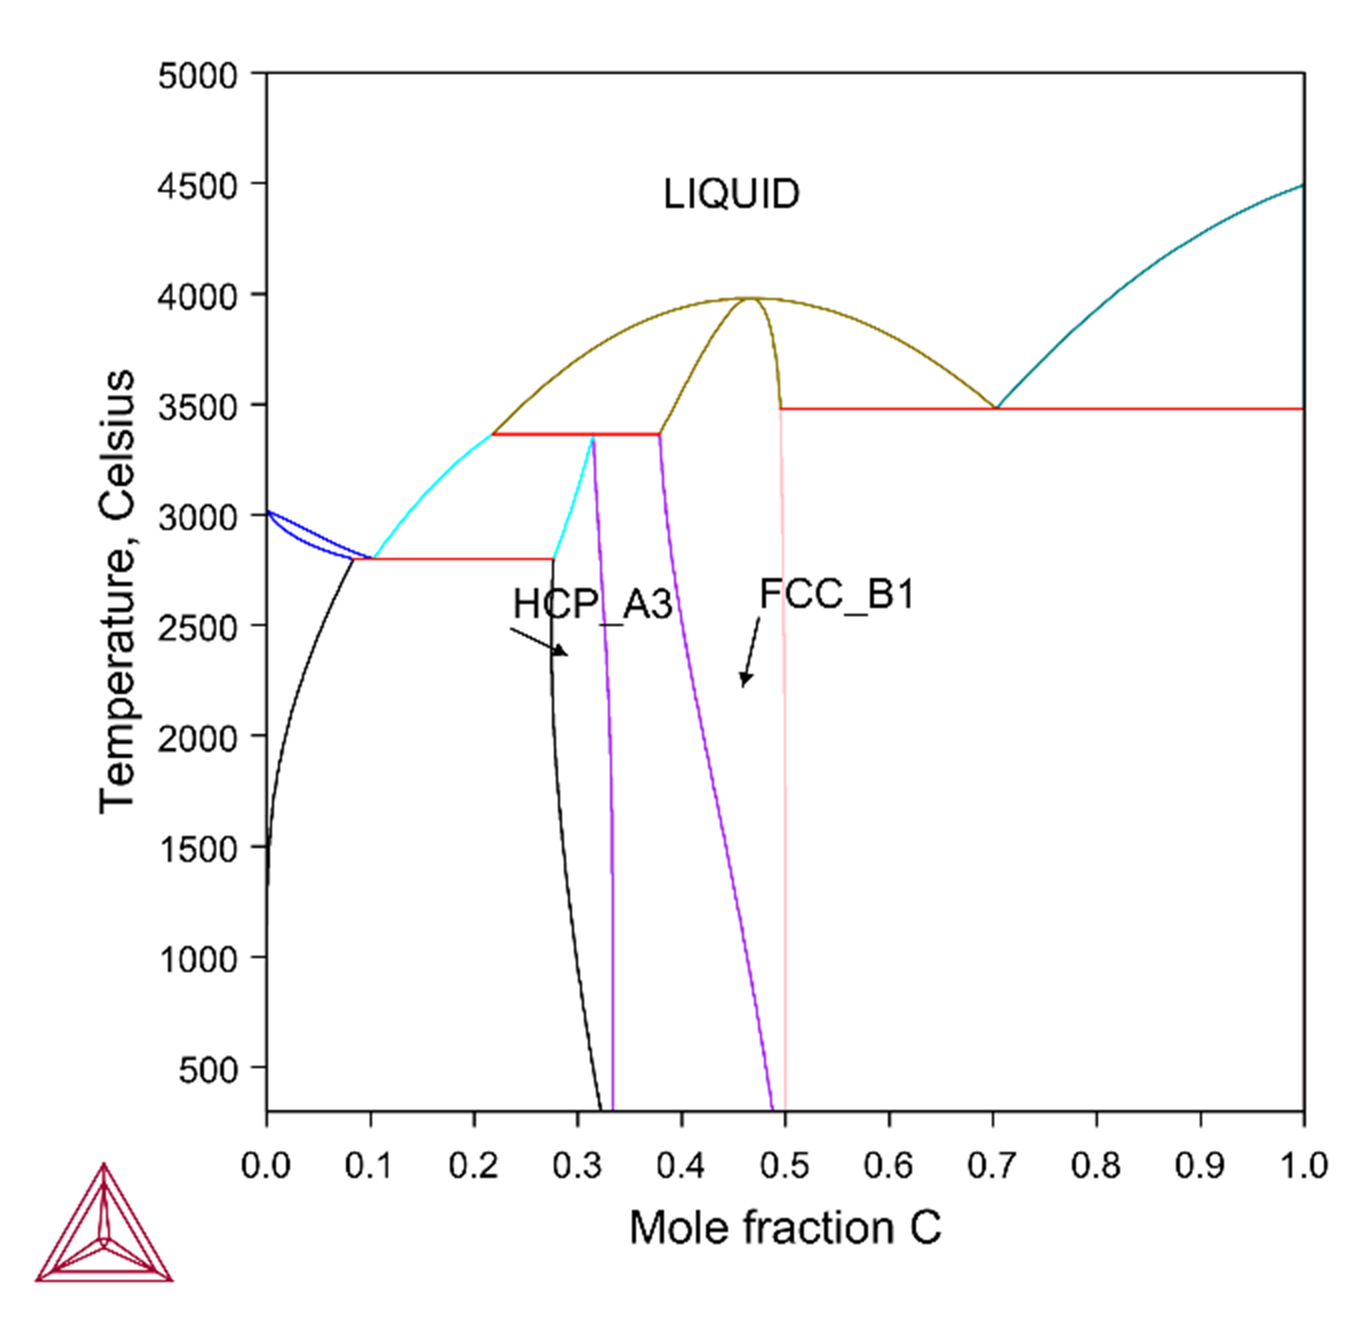
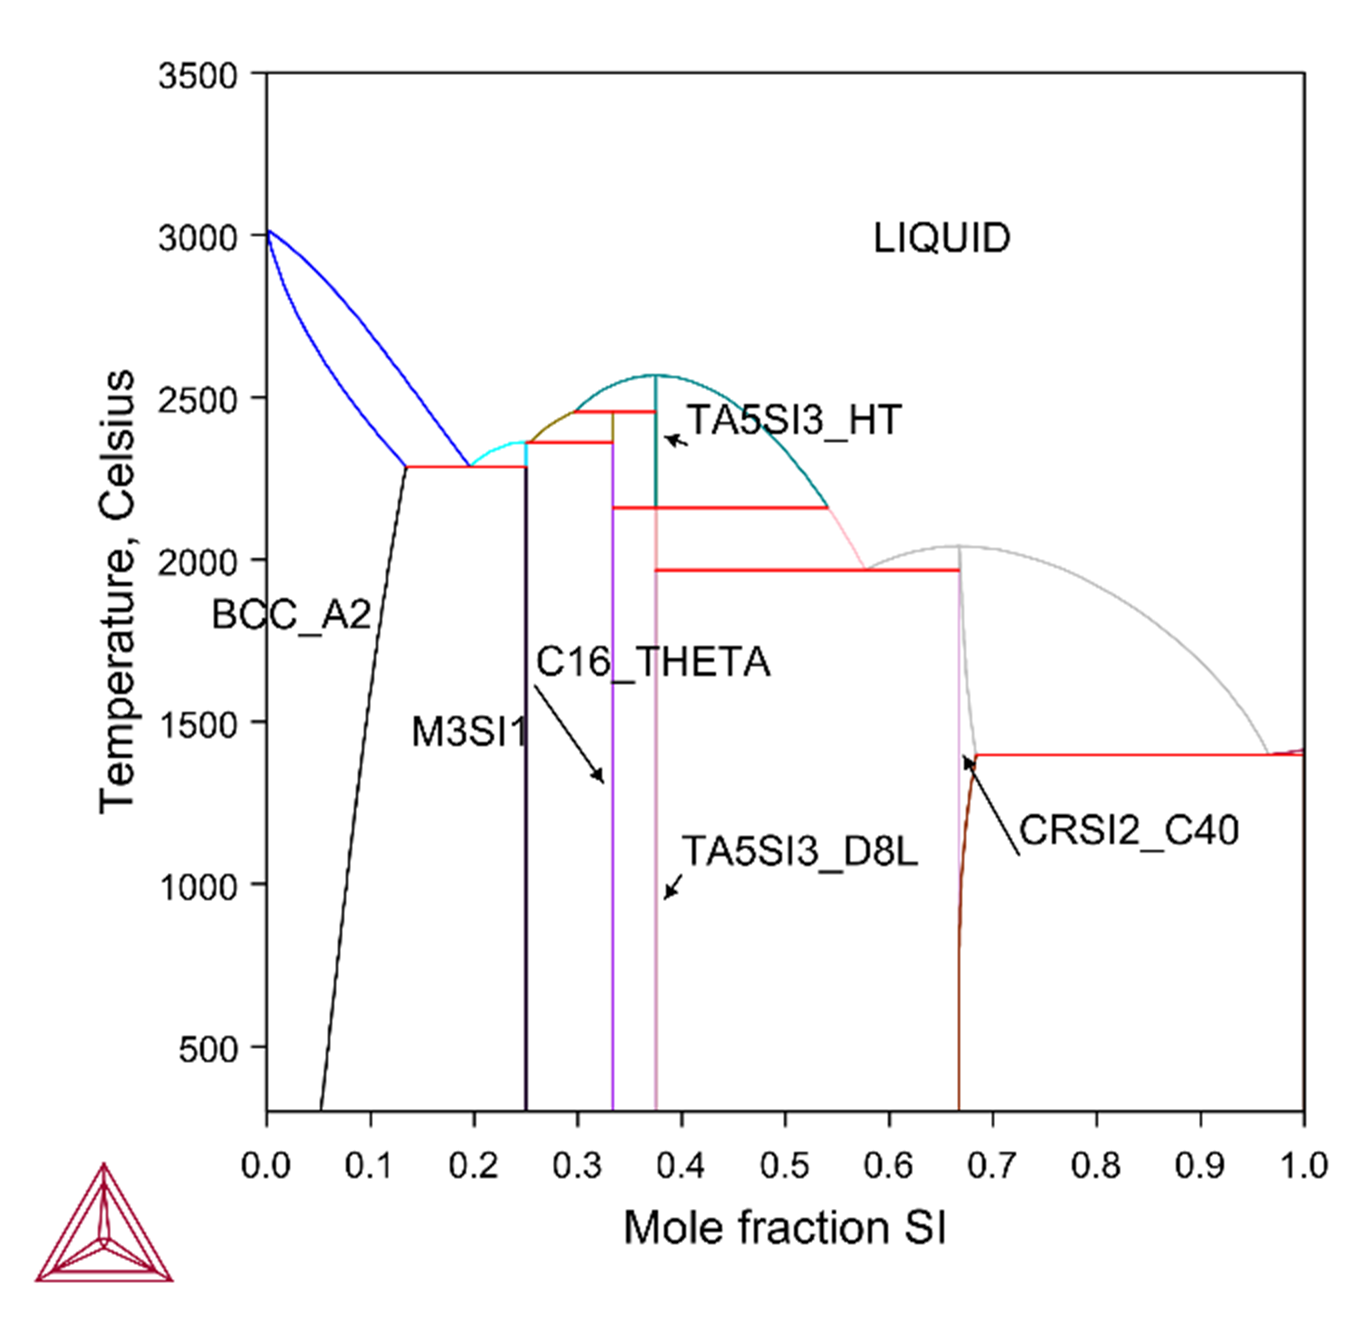
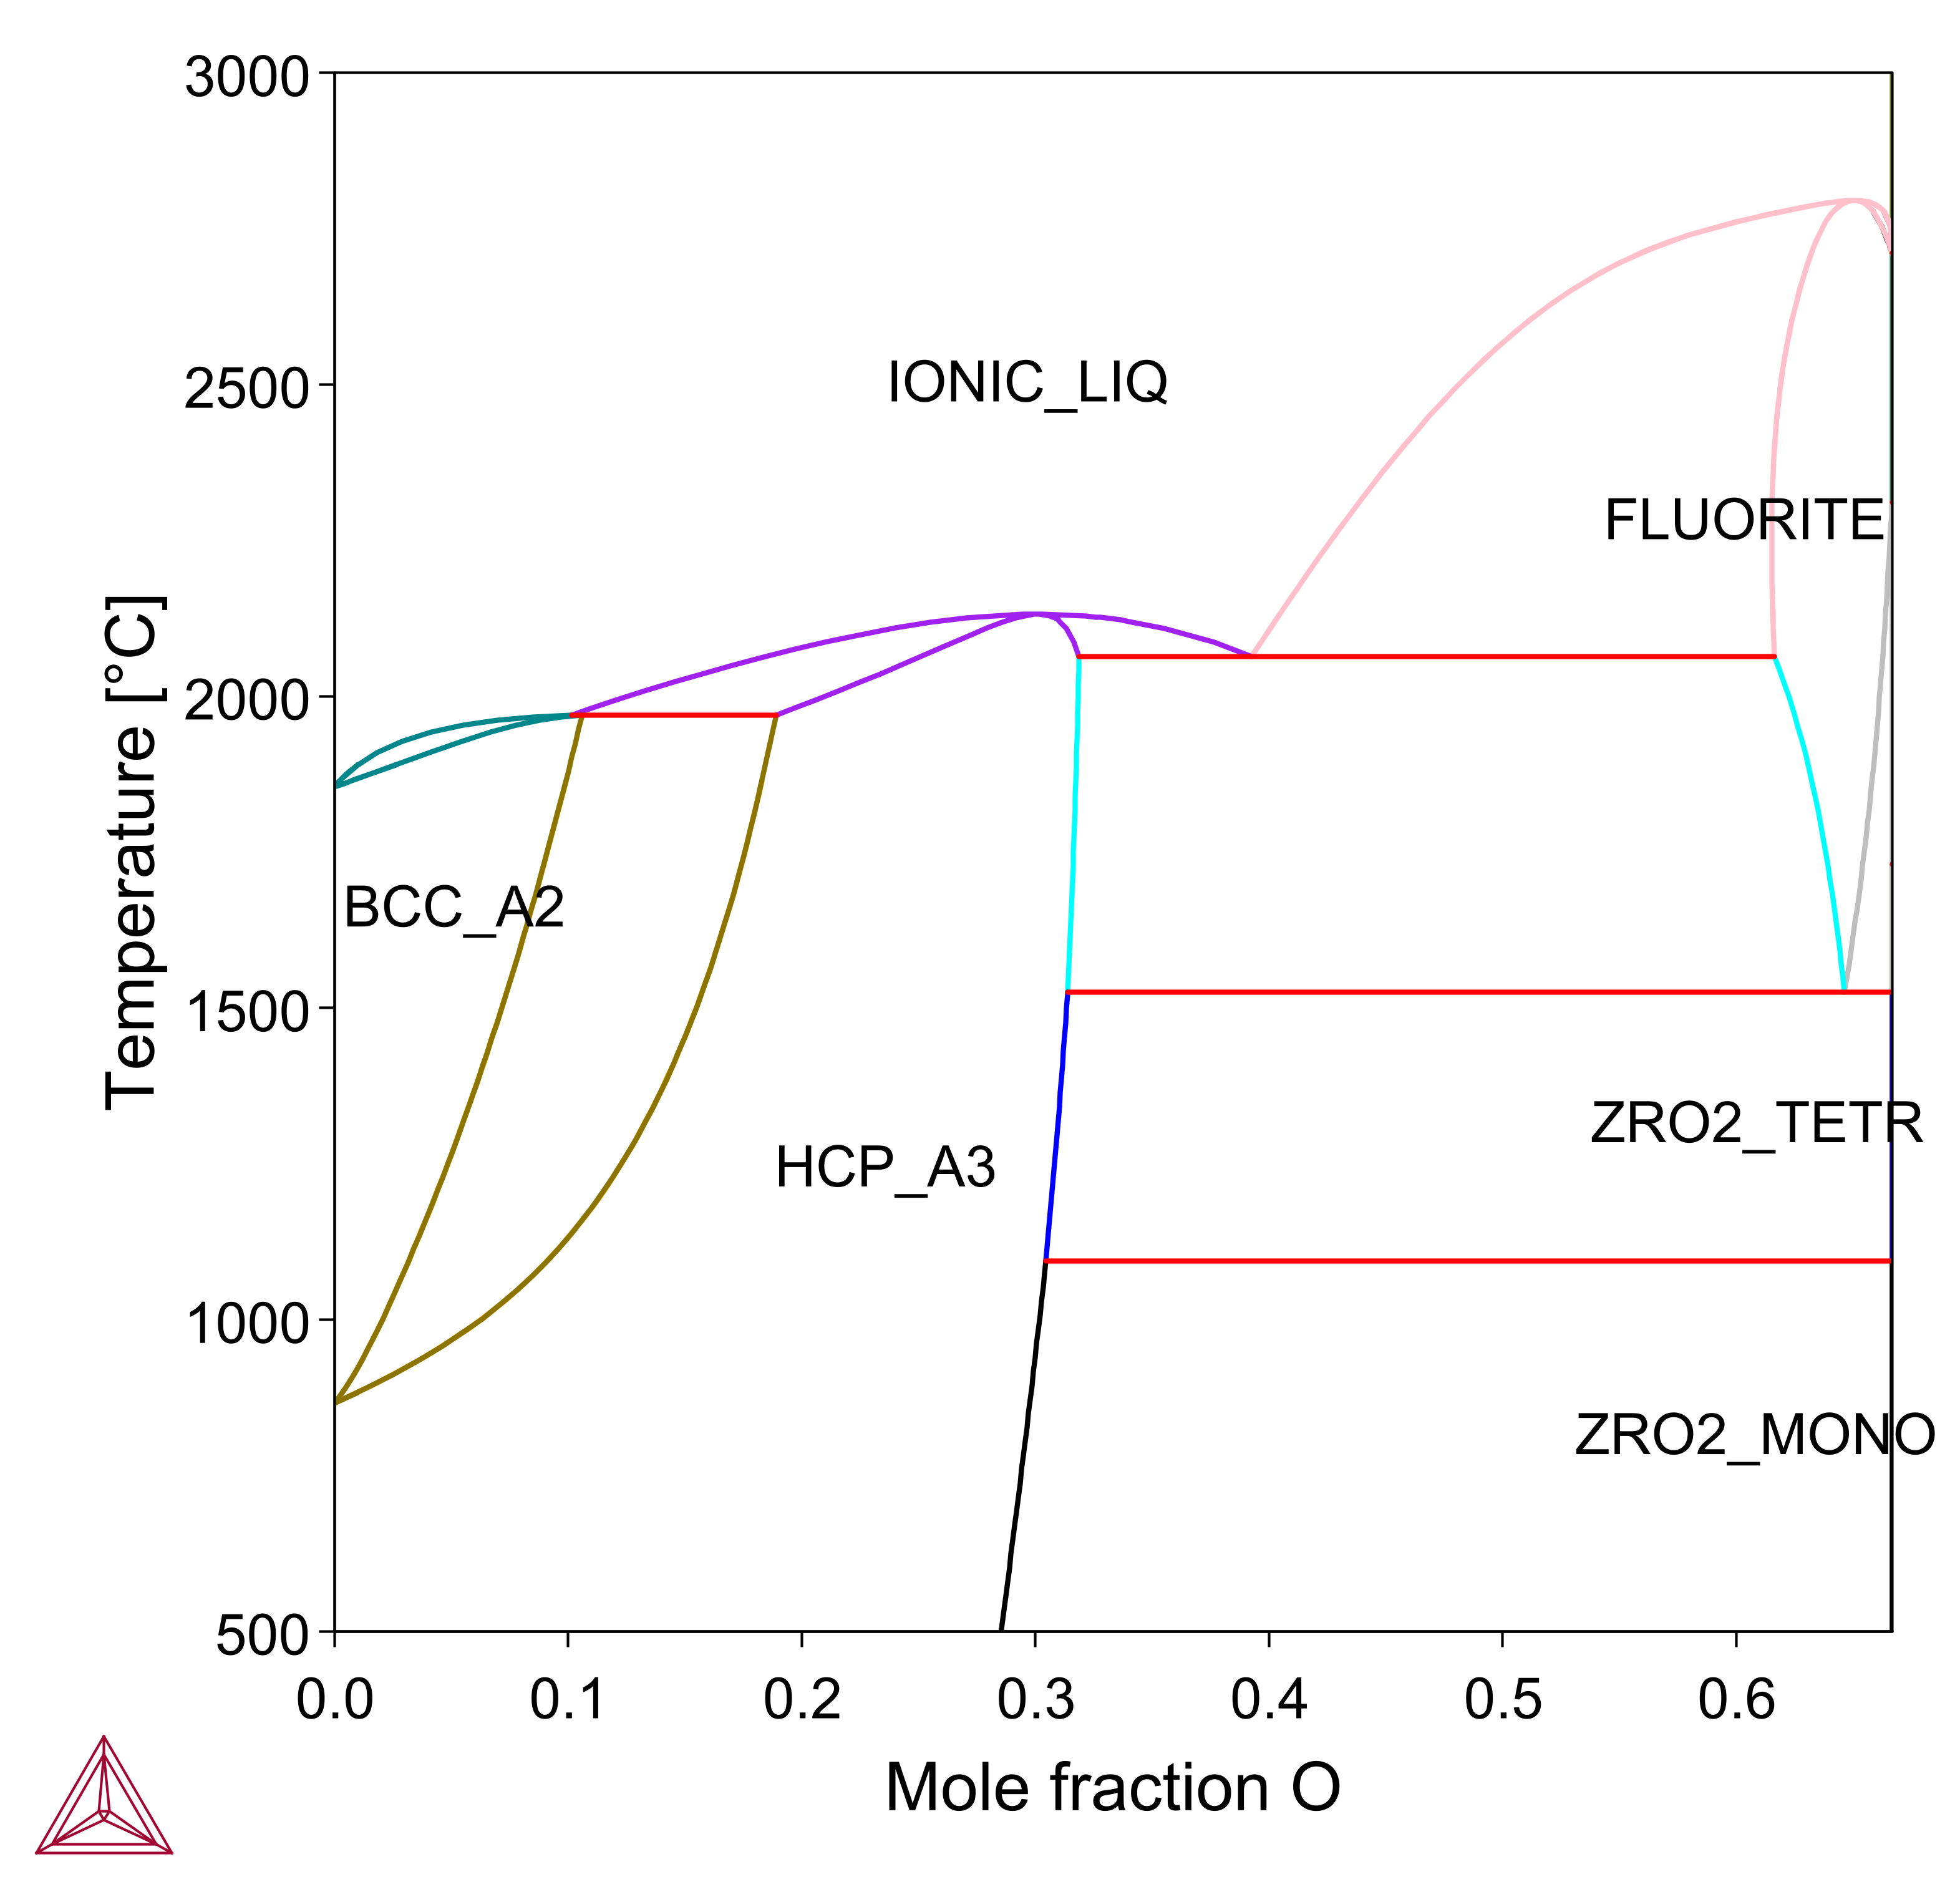
Binary Phase Diagrams
You can use the TCS Ultra-high Temperature Materials Database (TCUHTM) to plot binary phase diagrams in Thermo-Calc. Each assessed binary system is modeled to accurately describe experimental phase diagram data available in the literature. These examples show a selection of the important assessed systems that are the building blocks of the database itself when applying the CALPHAD method.
The CALPHAD Method and the Thermo‑Calc Databases. Also visit the video tutorials on our website or our YouTube playlist.
