Ternary Phase Diagrams
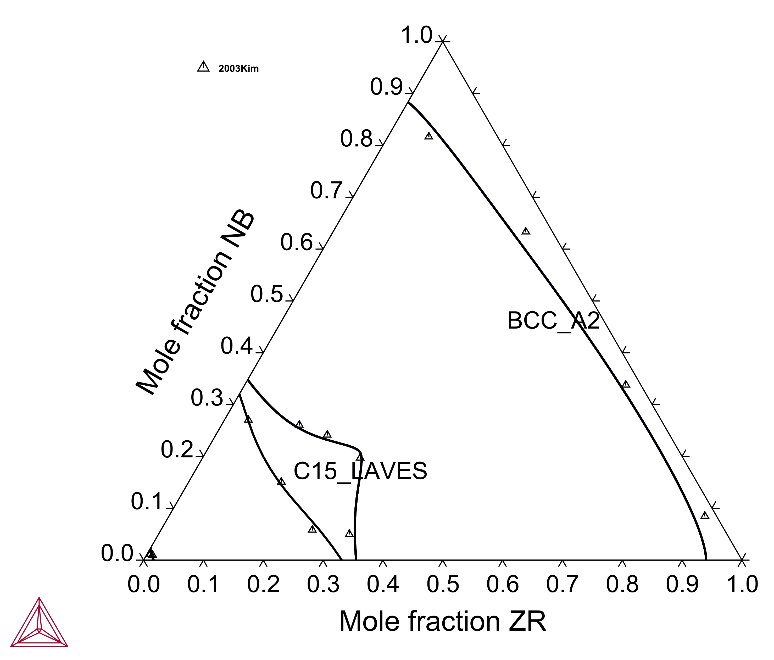
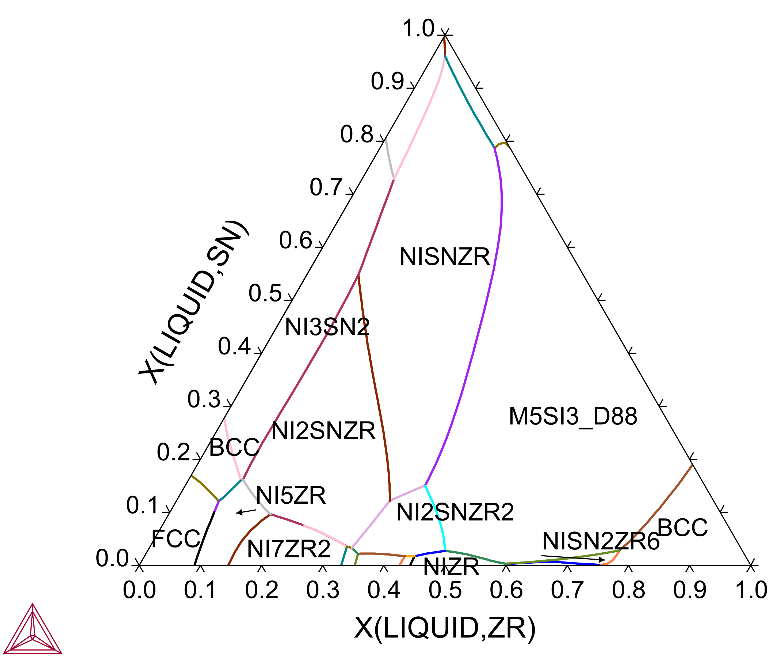
You can use the TCS Zr-based Alloys Database (TCZR) to plot ternary phase diagrams in Thermo-Calc. Each assessed ternary system is modeled to accurately describe experimental phase diagram data available in the literature.
These examples show a selection of the important assessed systems that are the building blocks of the database itself when applying the CALPHAD method.
The CALPHAD Method and the Thermo‑Calc Databases. Also visit the video tutorials on our website or our YouTube playlist.
When working in Thermo‑Calc with ternary diagrams you use either the Ternary Calculator (in Graphical Mode) or the Ternary module (in Console Mode). The fundamental calculation engine is the same but you access the settings in different ways.
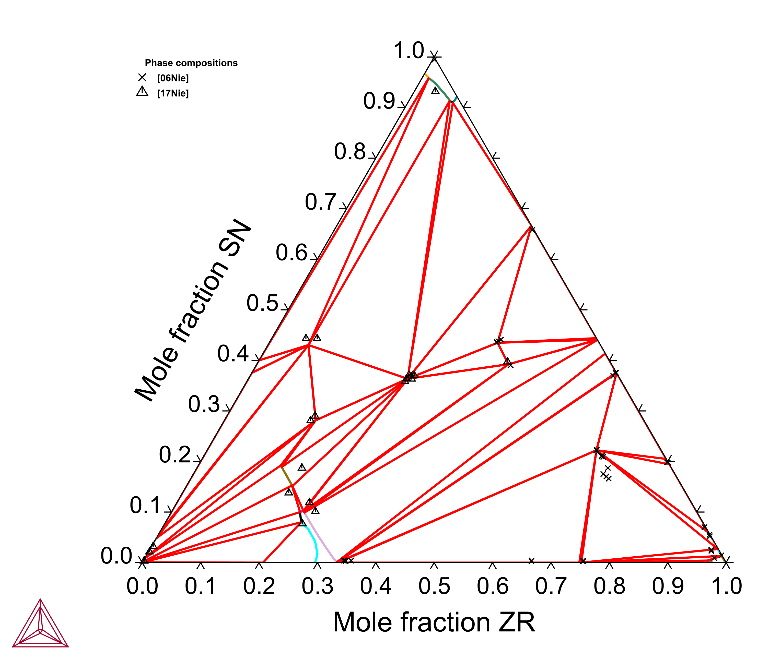
Fe-Sn-Zr
Figure 2: Calculated Fe-Sn-Zr isothermal section at 1073 K with experimental phase compositions determined by [2006Nie] and [2017Nie].
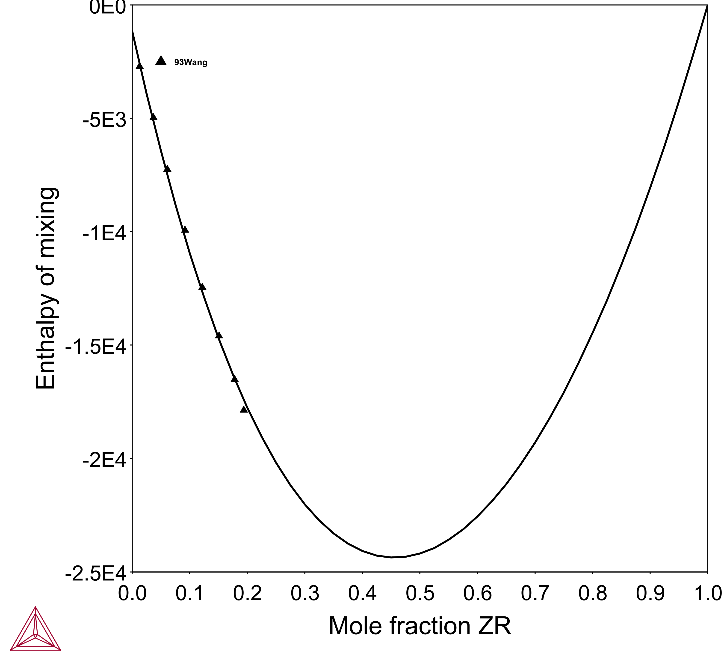
Fe86N14-Zr Alloys
Figure 3: Calculated enthalpy of mixing of liquid Fe86N14-Zr alloys at 1873 K with experimental data from [1993Wan].
References
[1993Wan] H. Wang, R. Lück, B. Predel, Thermodynamic investigation on liquid iron-nickel-zirconium alloys. J. Phase Equilibria. 14, 48–53 (1993).
[2003Kim] W.-Y. Kim, T. Takasugi, Laves phase fields in Cr–Zr–Nb and Cr–Zr–Hf alloy systems. Scr. Mater. 48, 559–563 (2003).
[2006Nie] N. Nieva, D. Arias, Experimental partial phase diagram of the Zr–Sn–Fe system. J. Nucl. Mater. 359, 29–40 (2006).
[2017Nie] N. Nieva, C. Corvalán, M. J. Jiménez, A. Gómez, C. Arreguez, J.-M. Joubert, D. Arias, Phase diagram of the Fe-Sn-Zr system at 800 °C. J. Nucl. Mater. 487, 186–191 (2017).


