Running and Plotting the Multiphase Simulation Results
Run the simulation.
simulate
Go to the post processor.
post
Plot the mole fraction fcc phase as a function of distance at the end of the heat treatment.
set-plot-condition time last
set-diagram-axis x distance global
set-diagram-axis y npm(fcc)
Instead of explicitly entering the final time it is possible to use the keyword last. The np of npm stands for number of moles of the phase argument and the m is the normalizing quantity (moles). The limits of an axis can be set with the set_scaling_status command. You manually set the scaling of the axis and then restore automatic scaling:
SET_SCALING_STATUS
<X OR Y AXIS>
<USE AUTOMATIC SCALING Y/N>
<IF MANUAL SCALING, ENTER LIMITS>
set-scaling-status x n 1e-3 2e-3
Plot the diagram.
plot
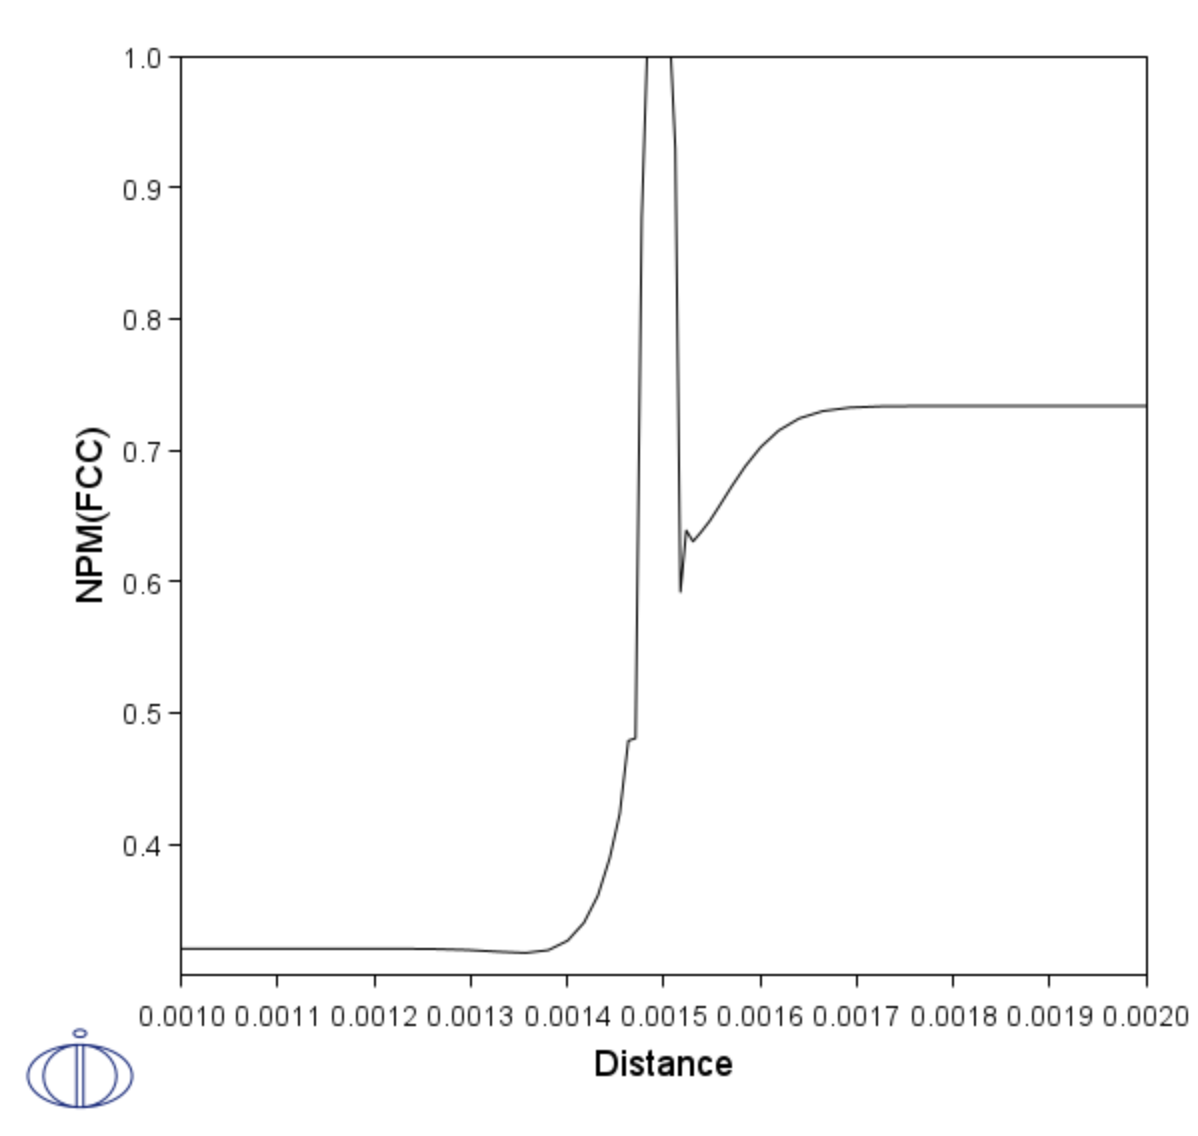
The plot below shows that a single phase fcc zone has formed and this was also observed experimentally, see [1995Eng].
Output from the multiphase_example showing the mole fraction fcc phase as a function of distance at the end of the heat treatment.
Reference
[1995Eng] A. Engström, Interdiffusion in multiphase, Fe-Cr-Ni diffusion couples. Scand. J. Metall. 24, 12–20 (1995).
