Plot Renderer Settings (Moving Phase Boundary)
After you have completed the settings for the System Definer and Diffusion Calculator you define the plot parameters.
- In the Project window, click the Plot Renderer node.
- In the Axes section, choose Time for X and select Hours.
- Choose Position of interface for Y. After you click Perform, the Interface list is populated.
- Right-click the Plot Renderer and rename it to
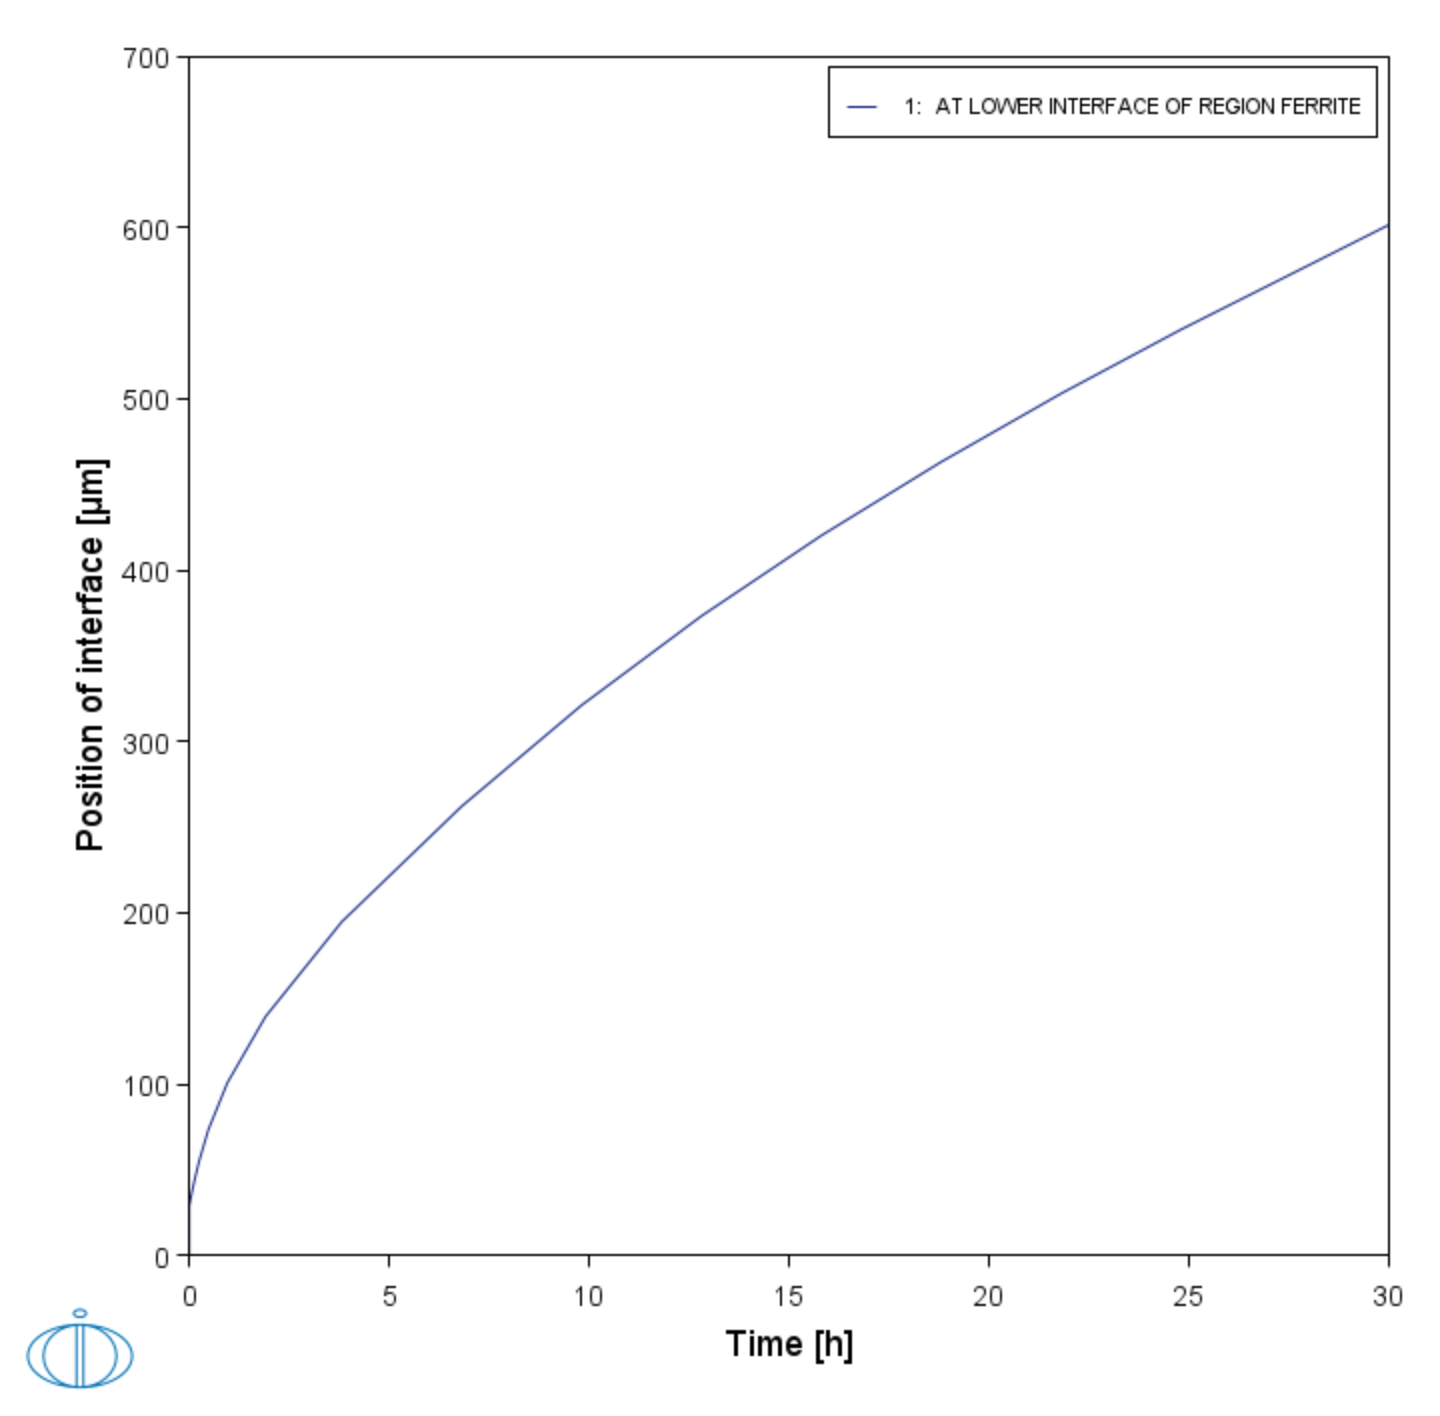
Position of interface vs time. - Click Perform. If you have entered the same settings the plot shows the ferrite/austenite phase interface position as a function of time. The plot has the parabolic appearance characteristic for many types of diffusion simulations.
Plot result from the example showing the phase interface position as a function of time.
Add a Second Plot
- Right-click the Diffusion Calculator node. Remember it is renamed to Diffusion two regions Ferrite and Austenite.
- From the Create New Successor list, click Plot Renderer.
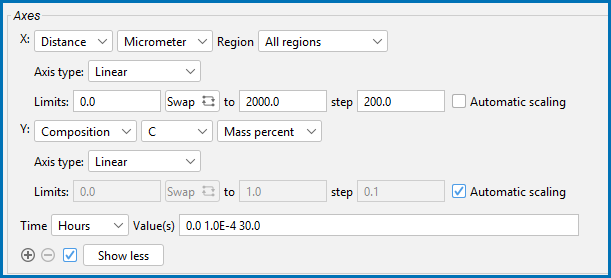
- In the new Plot Renderer node Configuration window Axes section, for X, change the Distance units to Micrometer.
- Click Show more, then click to clear the Automatic scaling checkbox.
- In the Limits fields, keep
0.0as the lower limit, enter2000for the upper limit and200for step. - For Y, keep the default Composition and choose C from the list.
- Choose Hours as the Time unit and enter
0.0 1.0E-4 30.0in the field. - Right-click Plot Renderer and rename it to
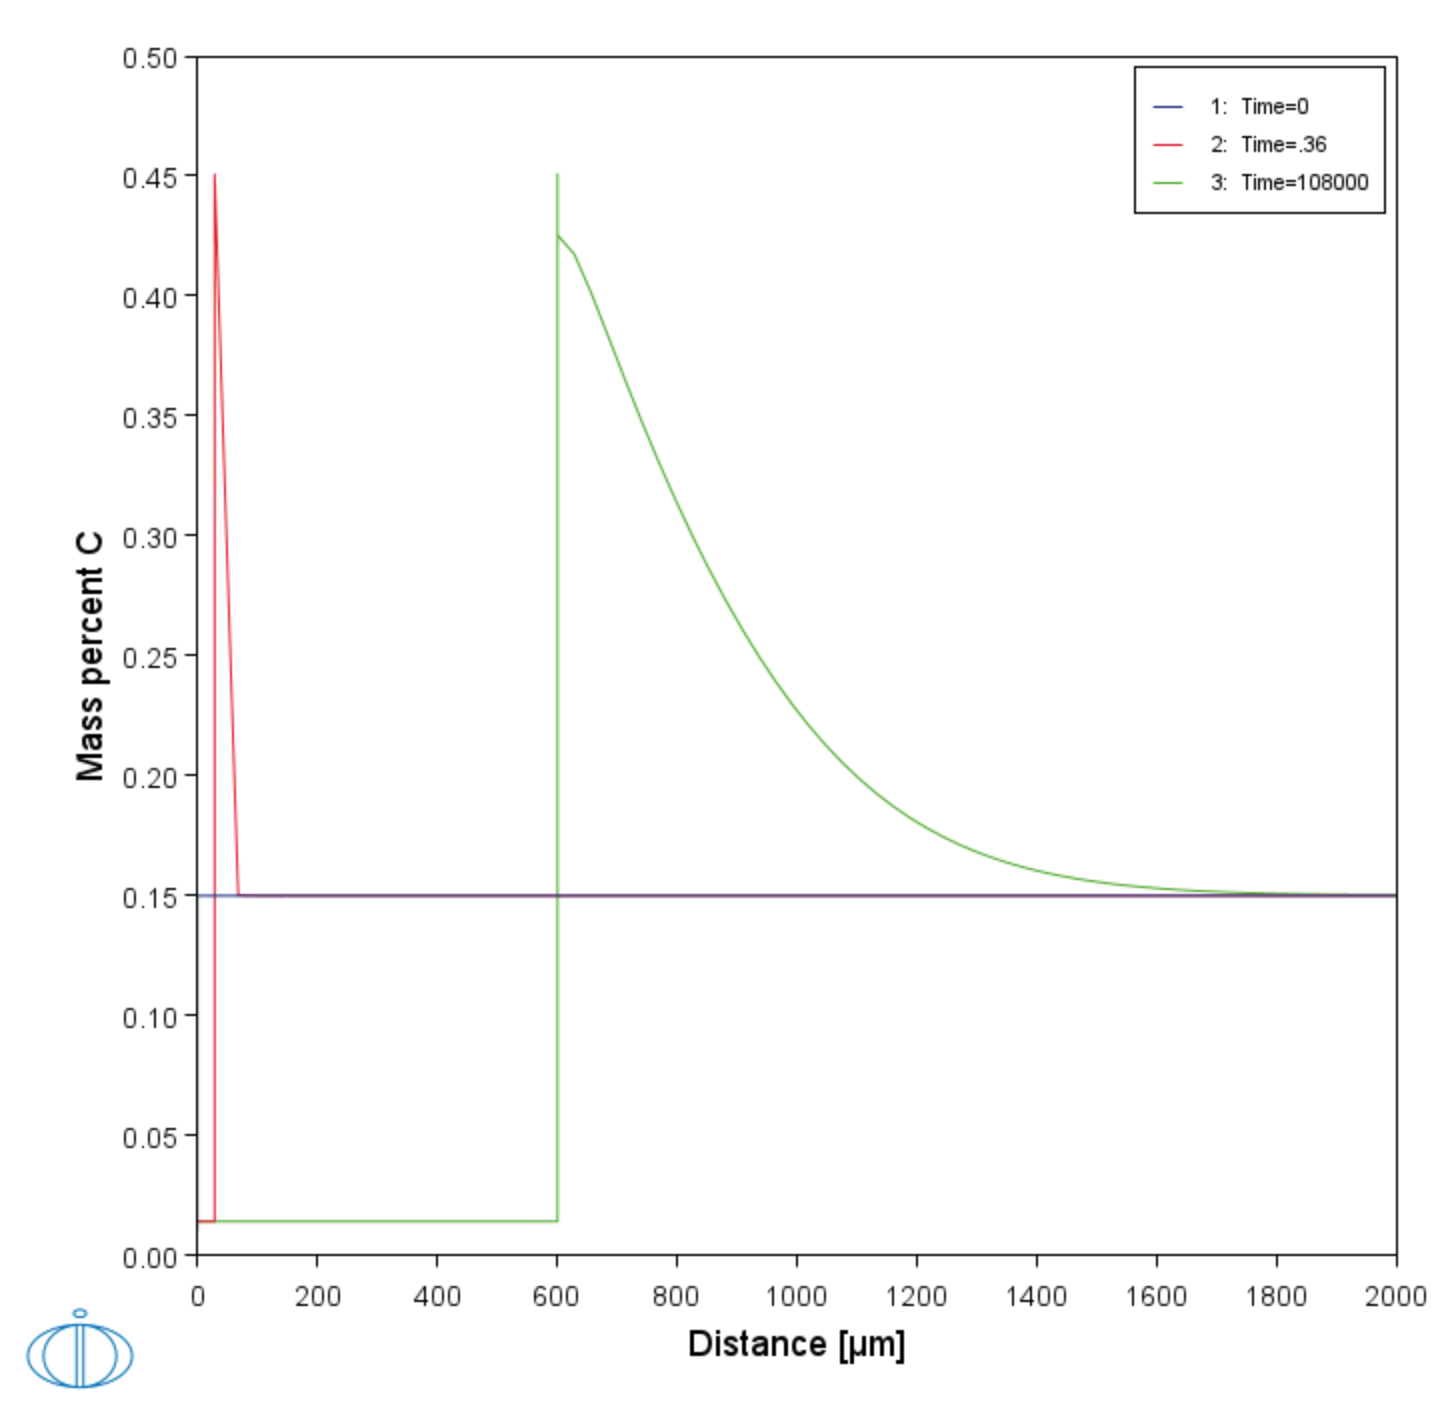
Composition profile C. - Click Perform If you have entered the same settings the plot shows the composition profile of C.


