PM_Noble_01: Color Prediction
The Optical Properties - Noble Property Model, available with the Property Model Calculator and the Noble Metal Alloys Model Library, is used to simulate the color, reflection, and transmission of light, based on modeling the alloy microstructure and the resulting optical properties. This model is currently applicable for the Au-Al-Ag-Cu-Pt system.
For more information about the Property Model, see About the Optical Properties - Noble Metals Property Model and Optical Properties - Noble Metals Property Model Settings.
This example uses the Property Model Calculator with the Optical Properties - Noble Property Model.
The example demonstrates three use cases for simulating color in the Ag-Au-Cu alloy system (1) screening the color of the alloy system (2) designing a green-gold alloy by adjusting Ag content, and (3) visualizing the impact of alloy thickness and light incident angle on color.
- Folder: Property Models → Noble Metals
- File name:
PM_Noble_01_Color_Prediction.tcu
To run calculations with the Noble Metal Alloys Models (as part of the Noble Metal Alloys Model Library) requires a valid maintenance license plus a license for the TCNOBL (version 3 and newer) database.
Visualizations
Many of our Graphical Mode examples have video tutorials, which you can access in a variety of ways. When in Thermo‑Calc, from the menu select Help → Video Tutorials, or from the main My Project window, click Video Tutorials. Alternately, you can go to the website or our YouTube channel.
Open the example project file to review the node setup on the Project window and the associated settings on the Configuration window for each node. For some types of projects, you can also adjust settings on the Plot Renderer Configuration window to preview results before performing the simulation. Click Perform Tree to generate plots and tables to see the results on the Visualizations window.
When you run (Perform) this example, it takes a few minutes for the calculations to complete.
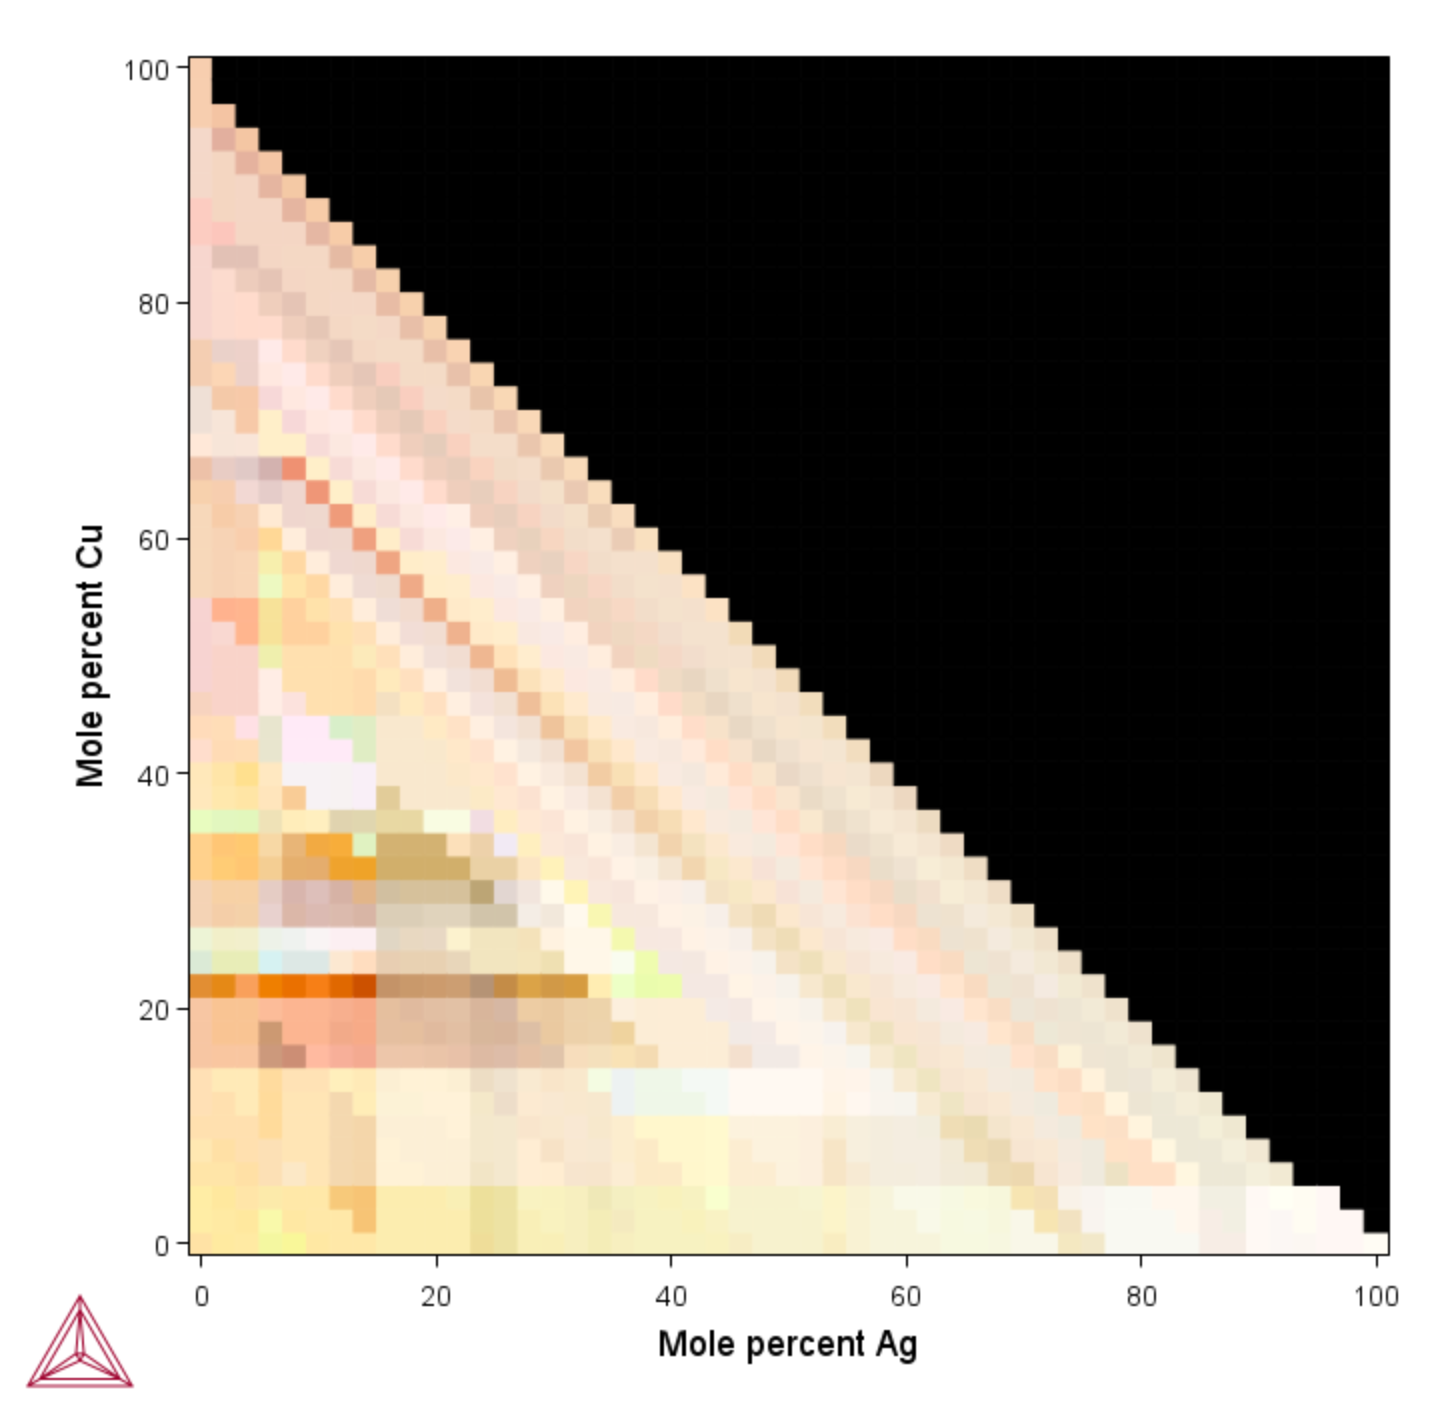
Screening the Color of the Ag-Au-Cu Alloy System
- The entire composition space was screened with a 2 wt.% step size.
- Alloys were annealed at 873.15 K to reach equilibrium phases and compositions for accurate color prediction.
- The standard illuminant is D65 noon daylight, with a 2˚ standard observer. The material is assumed to be opaque with a thickness of 10,000 nm.
- Some color predictions near the 20–40 wt.% Cu region require model accuracy improvements.
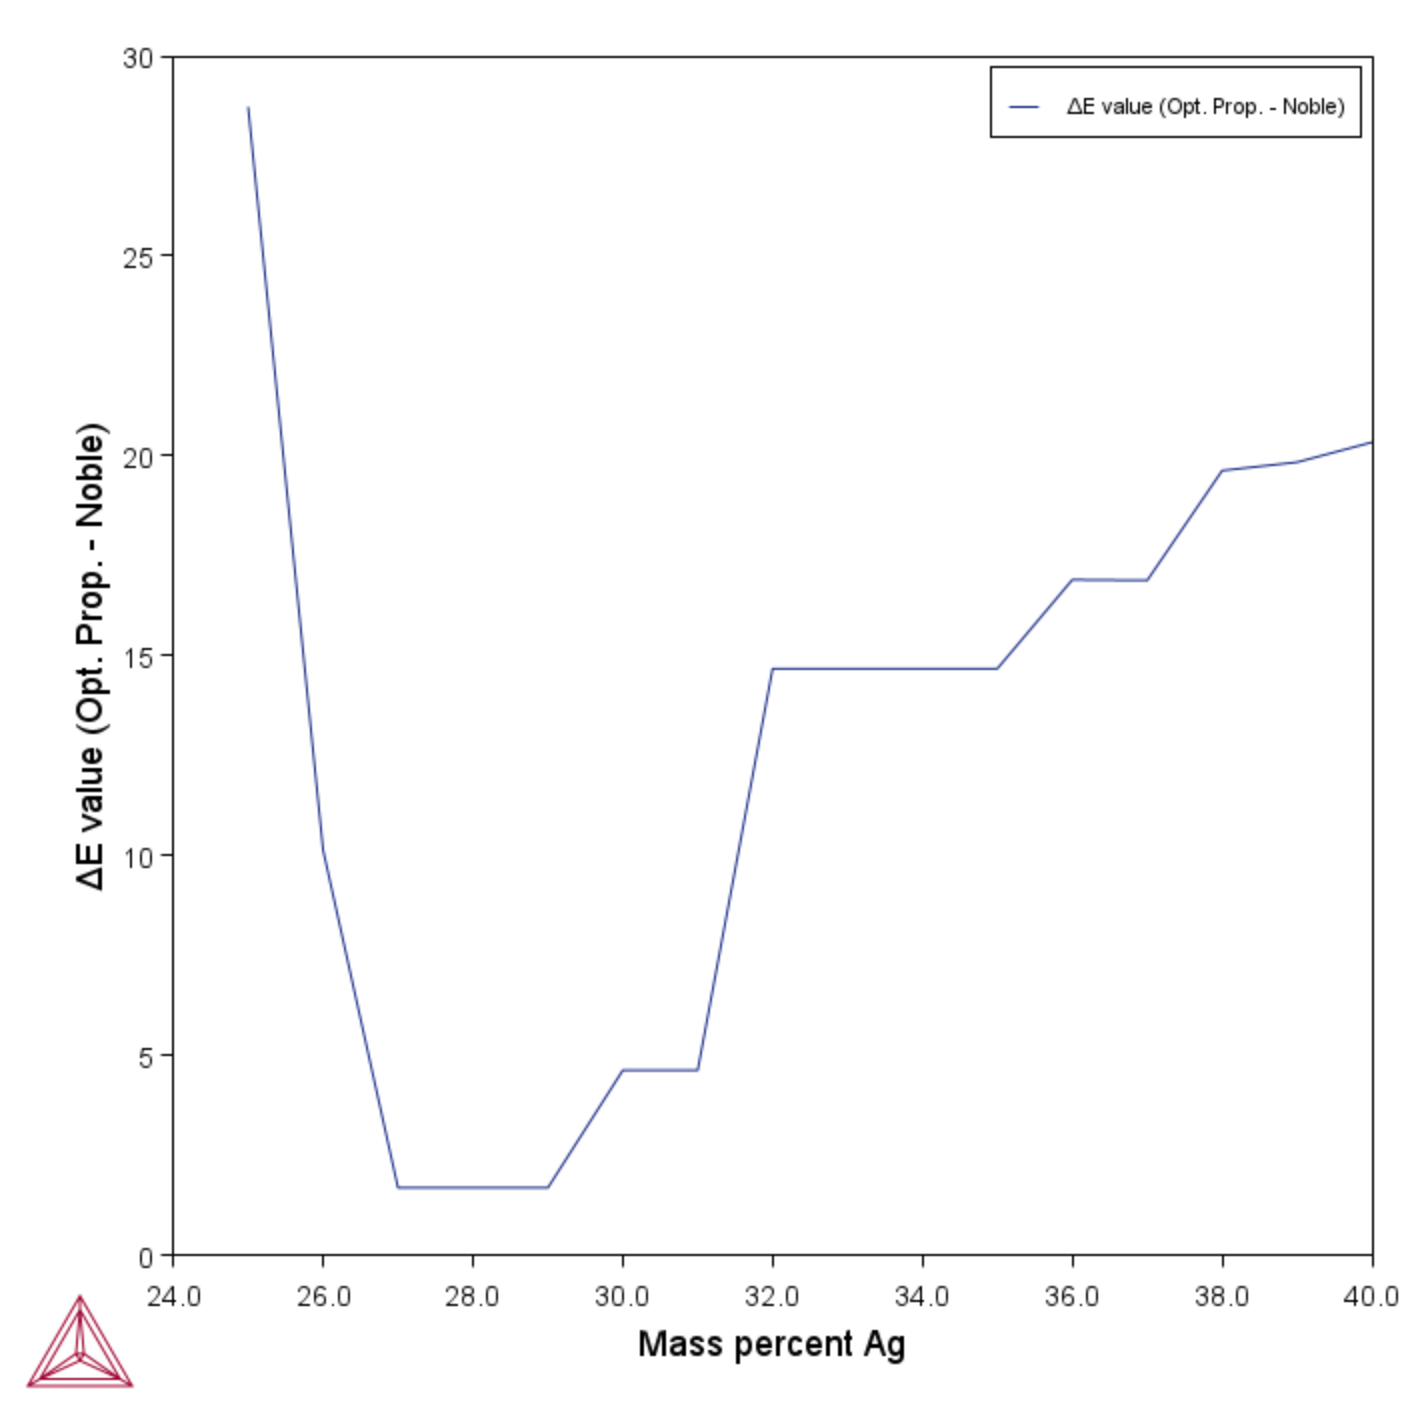
Designing a Green Gold Alloy by Adjusting Ag Content in Au-10Cu-xAg Alloys
- ΔE calculation box was chosen to enable the measurement of color differences.
- Target color in Lab color space is [95, -13, 25], representing a light green shade.
Figure 2: Change of color difference (ΔE) between the targeting light green gold and the simulated alloy when changing Ag content.
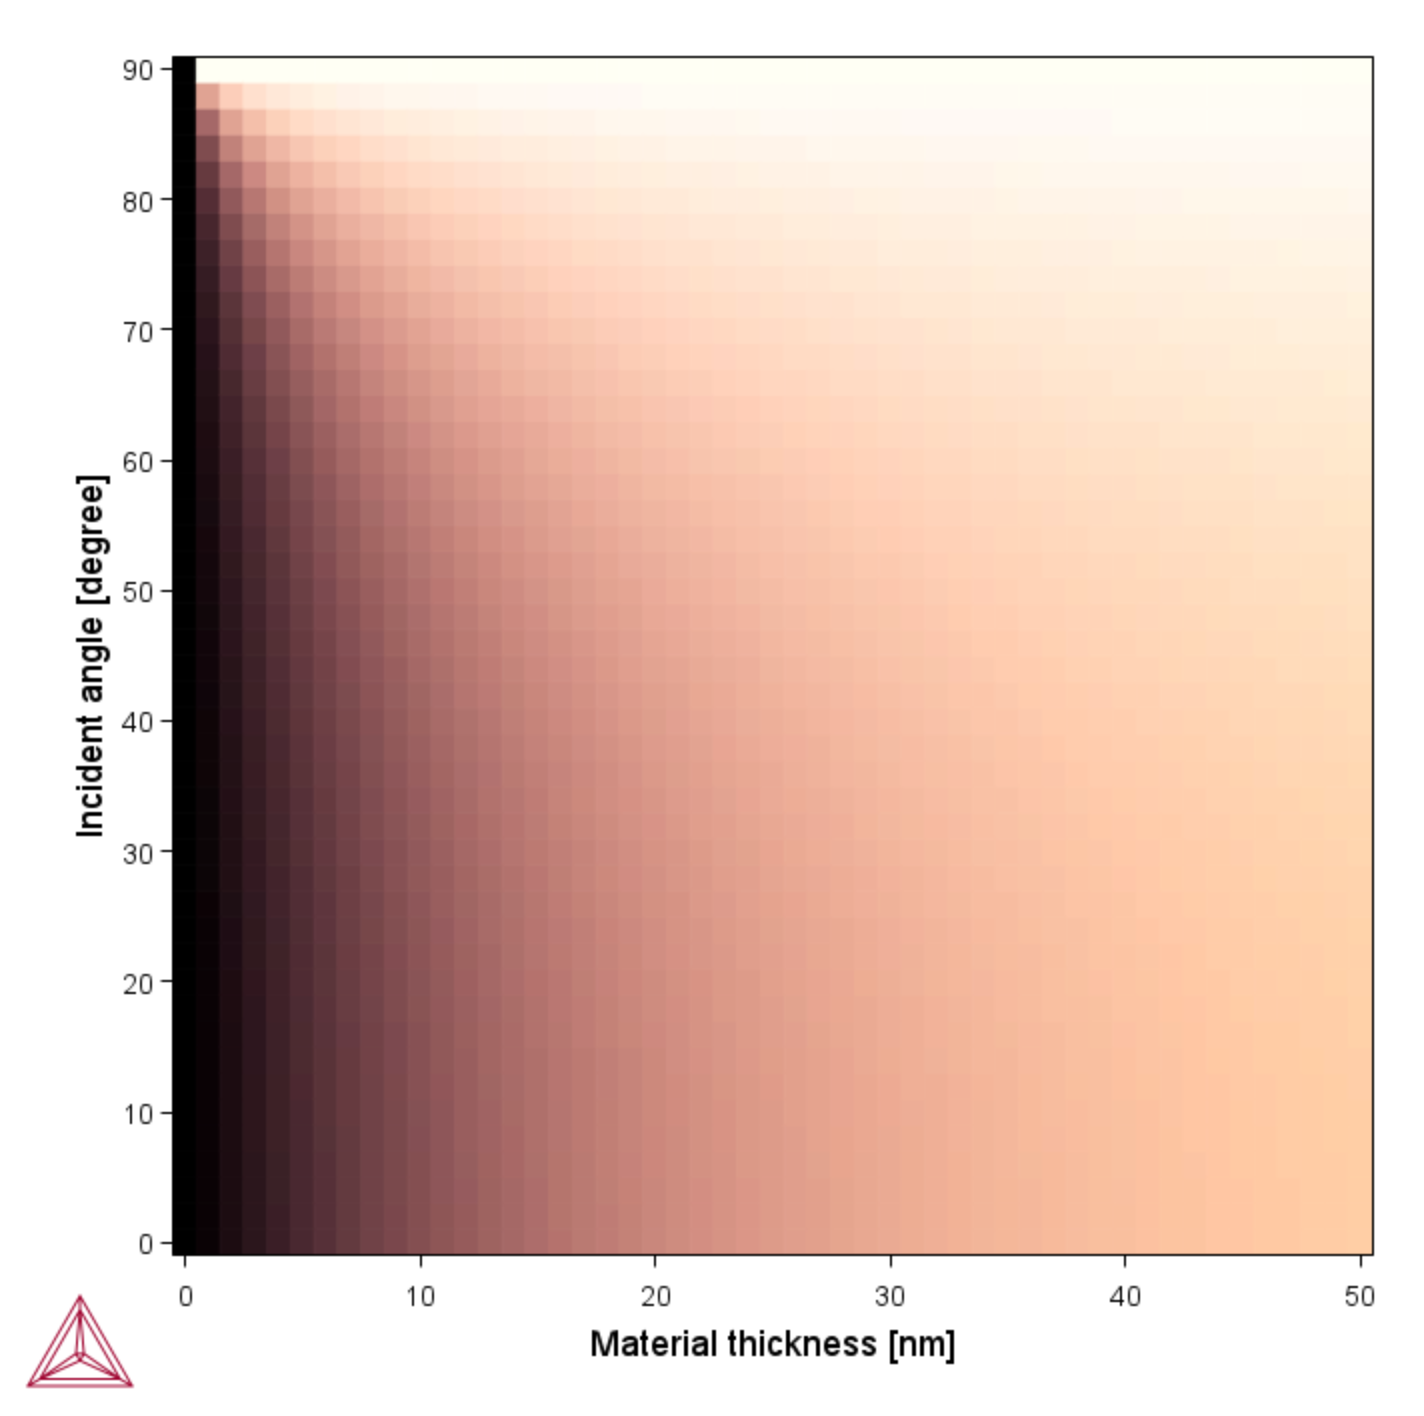
Visualizing the Impact of Alloy Thickness and Light Incident Angle on Color
- Intercritical annealing was not selected, as pure gold is in the FCC phase and does not require equilibrium calculations.
- As material thickness increases, the color of gold tends to approach the bulk gold color observed in macroscopic samples.


