Console Mode Results
The results of a calculation in Thermo‑Calc can be plotted by the post-processor module, also called the POST module. The diagram is displayed in the Console Results window.
In the POST module, you can define and plot various kinds of diagrams based on a calculation. You can modify diagram type, which variables to plot on each axis and between which minimum and maximum values, append experimental data from an EXP-file, change labels and symbols in the diagram, zoom in on (and out from) a certain region in a diagram, etc.
If you calculate a property or phase diagram in POLY, then you have to open the POST module yourself. If your calculation was performed by a response-driven module such as SCHEIL or POURBAIX, then the plotting of a diagram based your calculation is part of the dialogue of questions and answers you have in that module (but under the hood, the response-driven module is actually utilizing the POST module to get the plotting done).
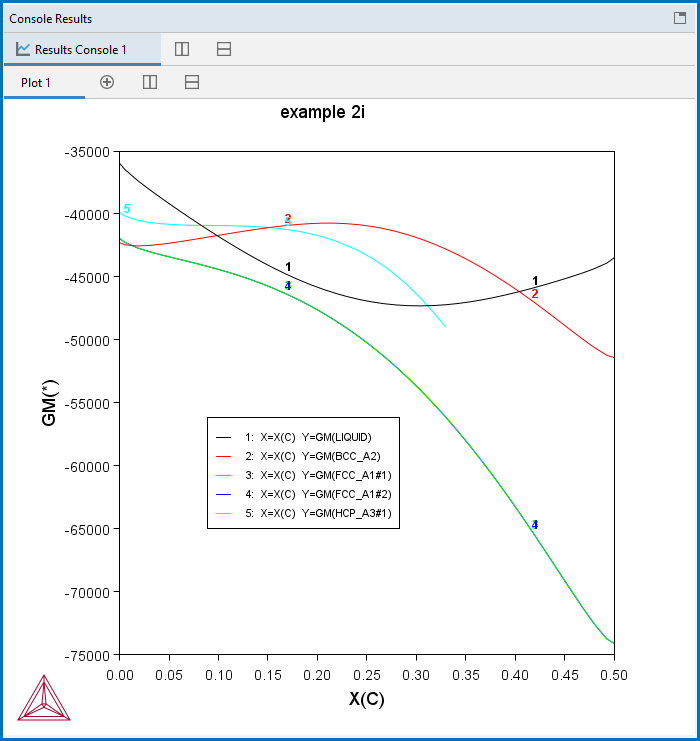
Example of output to the Console Results window.
