Modifying Diagrams
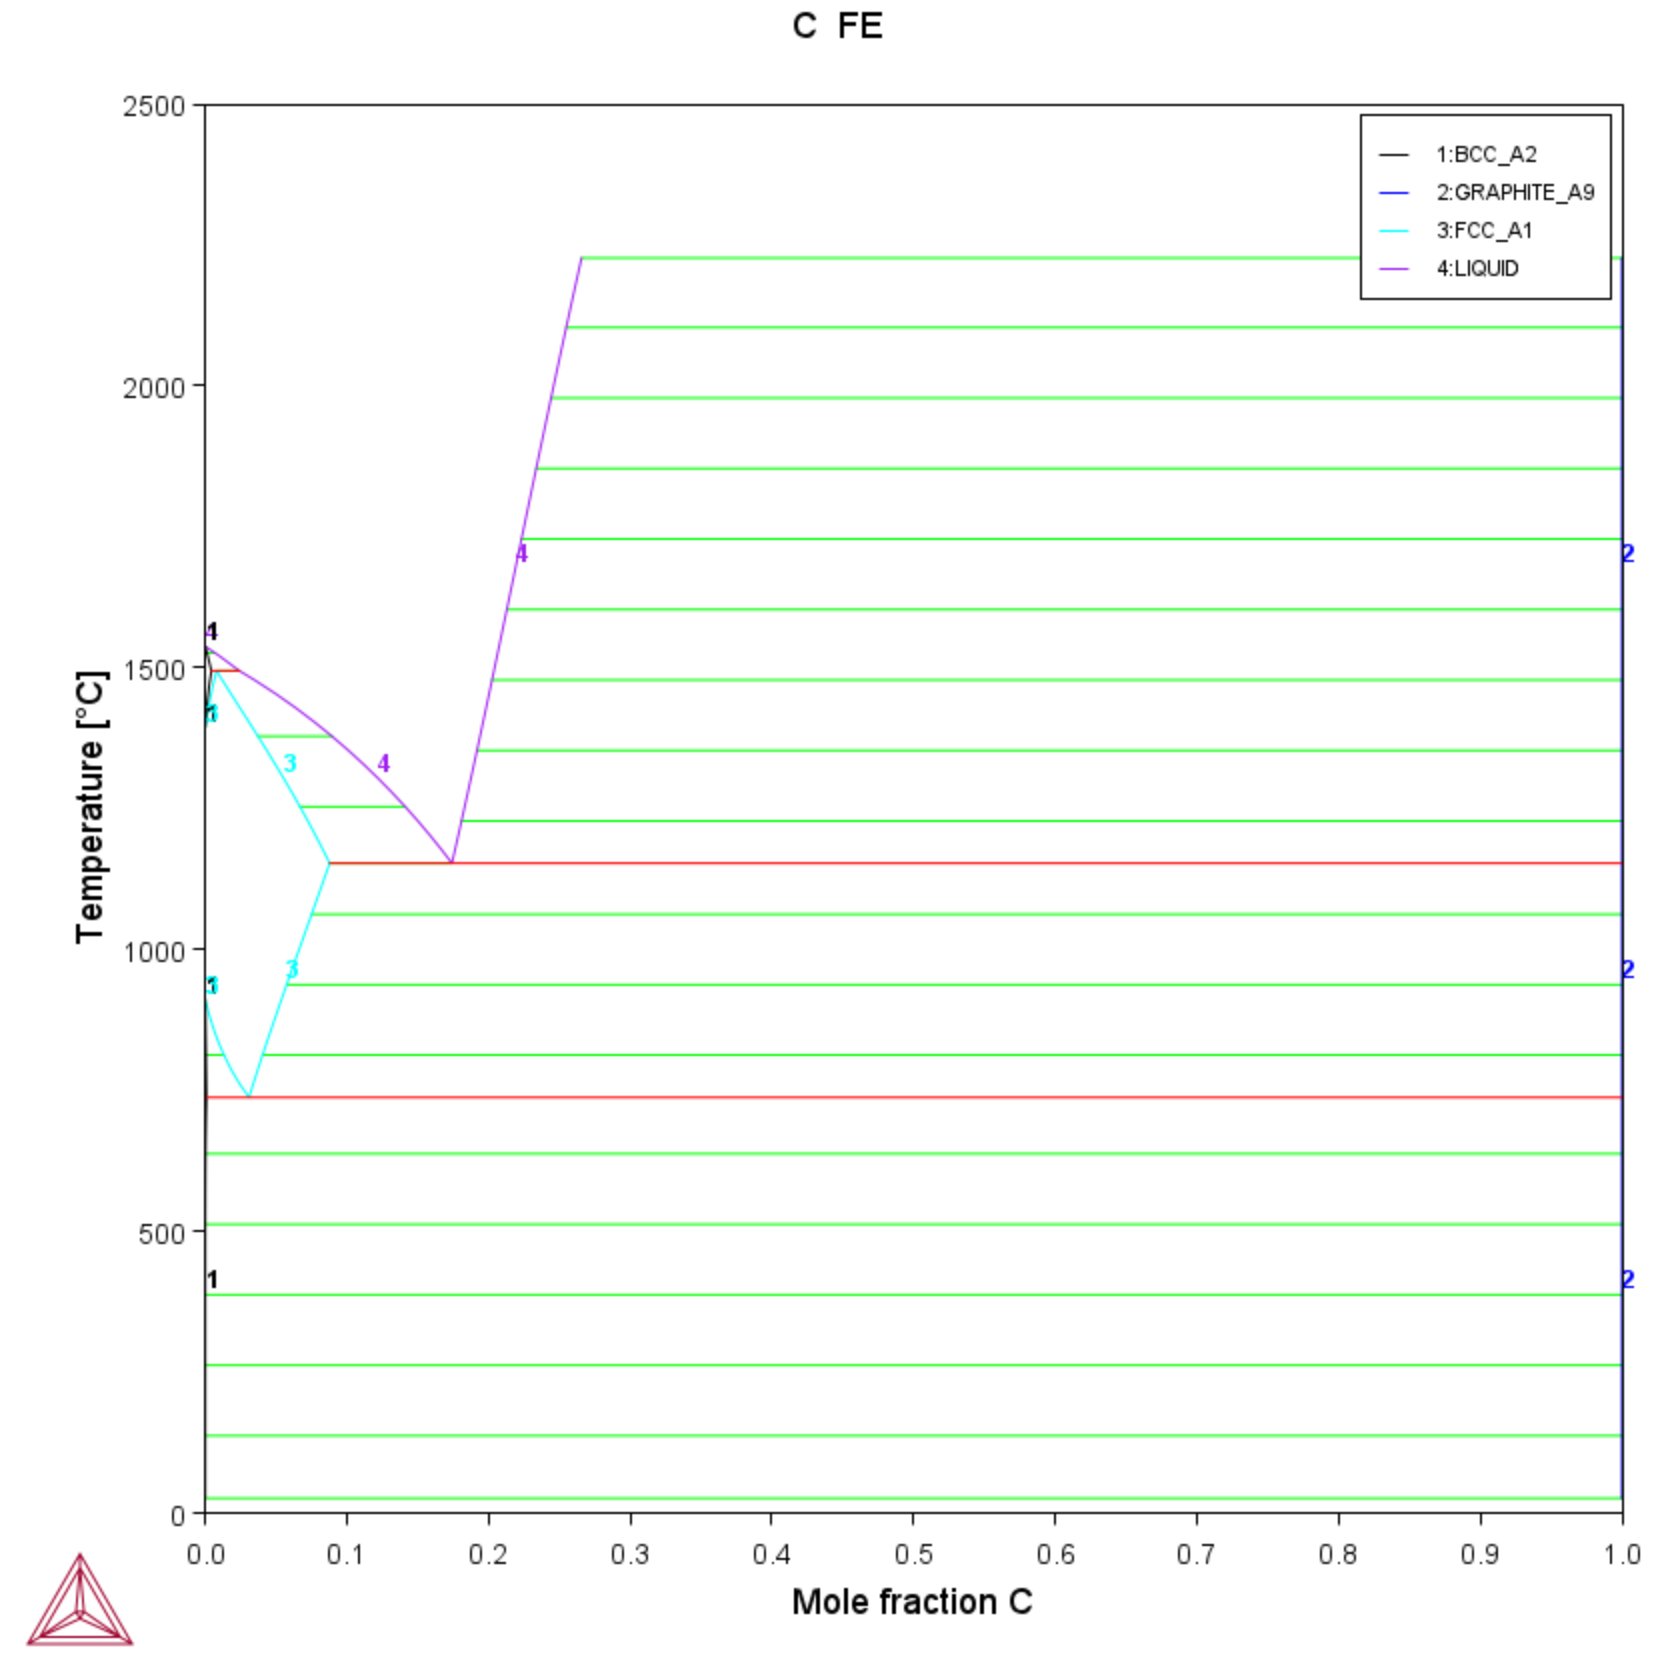
Modifying a diagram amounts to changing the settings that determine how the POST module presents the calculated results and plots a new diagram. Suppose that you have already plotted a binary phase diagram with the mapping axis variables temperature and mole fraction of one of your components (the Fe component, say) on the X- and Y-axes. If you then want to modify your diagram so that the Y-axis instead represents, say, the mass fraction of Fe rather than the mole fraction, then you use SET_DIAGRAM_AXIS to set diagram axis Y to w(Fe), and then use PLOT_DIAGRAM.
There are many ways in which you can modify your diagram and how it is presented. Any modification made in the plot settings is taken into account the next time you use PLOT.
The following are some of the modifications you can make. Use:
- SET_TITLE to set add a title or to change an already existing title. The title is displayed above the plotted diagram in the Console Results window.
- ADD_LABEL_TEXT to add a label text that starts at a certain X- and Y-coordinate. If you have plotted a phase diagram, then you can let Thermo‑Calc set the label text that specifies the names of the stable phases at that coordinate.
- SET_AXIS_TYPE to set whether the scale of an axis is linear, logarithmic or inverse.
- SET_DIAGRAM_TYPE to plot a triangular diagram with the X-axis on the triangle’s base and the Y-axis on the triangle’s left side. Such a diagram is often useful if you want to plot the fractions of two components in a ternary diagram.
- SET_SCALING_STATUS to modify the range of values that are displayed on an axis. In effect, you can use it to zoom in or out of the diagram. For example, to set the scale of the X-axis to range from 0 to 0 .3, type:
SET_SCALING_STATUS X N 0 0.3
The X specifies which axis to change the scaling on, the N turns off Thermo‑Calc’s automatic scaling, and 0 and 0.3 specifies the minimum and maximum values on the scale. You can turn on automatic scaling again by setting the second parameter to Y.
- SET_LABEL_CURVE_OPTION to label each set of curves that have the same stable phases with a certain digit. A legend is also added, where you specify which phases each digit designates.
