Plot Labels
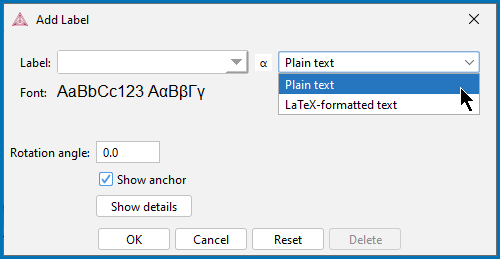
To add a label text at a certain point in a plot, right-click the point, and select Add Label. For phase diagrams, the program suggests a label that you can keep or edit. The suggested label specifies the names of the stable phases at the coordinate where you clicked. For all other plot types, you enter your own text, which can either be Plain text or LaTeX formatted text.
You can enter the label as Plain text or in LaTeX-formatted text. For LaTeX-formatted text enter or edit the text as required. For example, underscores (_) are added before the numbers to make subscripts in the label.
By default when using the LaTeX command, you are in math mode and Thermo‑Calc automatically interprets the entered text as math. The above link uses the dollar sign ($) in all the examples but this is NOT required. For example, if you enter $E=mc^2$ this is displayed including the $ instead of the equation.
