Changing the Plot Properties
To make local changes to the appearance of a specific plot, in the Visualizations window right-click a plot and select Properties.
The available settings are the same as what you can globally set under the Tools →  Options menus but are only applied to the specific plot. Below includes details about features that are unique to the local plot properties options.
To make global plot setting default changes, see the details in Global Settings: Graphical and Console Mode Plotting.
Edit Individual Plot Lines
You can also edit some properties for individual plot lines (the color, the line width and type, and whether data points are included).
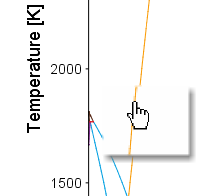
In the Visualizations window, hover the mouse over a plot line. When it is over a line that can be clicked the crosshair cursor turns into a pointing finger. Click the line and then you can make changes for that specific line.
To prevent unintended edits, hold down <Ctrl> while moving the cursor around the plot to only display it as a crosshair.
Color Switching Plots Between Light and Dark Mode
Depending on whether you are using a Light or Dark look and feel for the user interface (see Global General Settings), you can also switch the default colors (lines, background, and more) of a plot using this local Plot Properties option. Alternatively, to set the global defaults for future project files (and plots), see Global Plot Settings: Design the Look and Feel.
Use the Color switching option to override the look and feel settings that may not be optimal. For example, when preparing a plot for publication, the Dark mode plot or line colors may not work well or do not follow a journal's guidelines. In other words, you can view and export the plot with Light mode color settings even though the interface is using Dark mode, and vice versa.
Perform your calculation. Right-click in the Visualizations window and select Plot Properties. Select a Color switching option:
- Switch automatically between Light mode and Dark mode: The default, which matches the current look and feel for the GUI.
- Always use Light mode colors: If you are in Dark mode, this immediately switches the plot to Light default color settings.
- Always use Dark mode colors: If you are in Light mode, this immediately switches the plot to Dark default color settings.
Tie lines and invariant lines are the same color for both Light and Dark modes, i.e. these colors do not change.
When applying any of these settings, you can make further changes to the colors for the local plot but the change is locked to the mode. For example, you are in Dark mode and you change the plot background color to yellow. Then you switch to a Light look and feel mode. The background color for that plot is the default white background that is set for Light mode. Then if you change the background to blue, but now switch to a Dark look and feel, the background is yellow as this is the color applied in Dark mode to this particular plot. If you switch back to Light mode then the plot background is blue again.
