Precipitation Simulations
Precipitation particle size and its distribution have a decisive influence on the subsequent mechanical properties of high-strength and highly conductive precipitation hardened copper alloys. With a combination of TCS Cu-based Alloys Database (TCCU) and TCS Cu-based Alloys Mobility Database (MOBCU), the average size and number density, as well as volume fraction of a precipitate, can be predicted by using the Precipitation Module (TC-PRISMA) in Thermo‑Calc.
Read more about the Precipitation Module (TC-PRISMA) on our website. If you are in Thermo‑Calc, press F1 to search the help to learn about the available settings included with the Add-on Module.
Precipitation in Cu-Ni-Si Alloy
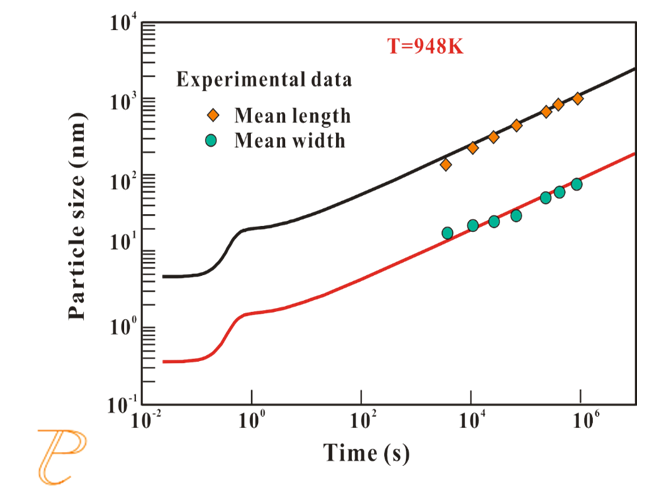
The Cu-Ni-Si alloy is a precipitation strengthening-type alloy and receives a lot of attention for its high strength and high electrical conductivity. In this example, the precipitation simulation is carried out in Cu-1.86 wt.% Ni-0.45 wt.% Si alloy at 948 K, from which a rod-shape precipitate (Ni2Si) precipitates in (Cu) matrix.
The simulated mean length (red line) and mean width (black line) of Ni2Si precipitates agree well with the measured values [2011Wat].
Figure 1: Simulated average length (red line) and width (black line) of rod-shaped precipitates with aging time for Cu-1.86wt.%Ni-0.45wt.%Si alloy at 948K compared with reported experimental data [2011Wat].
Precipitation in Cu-Co-Fe Alloy
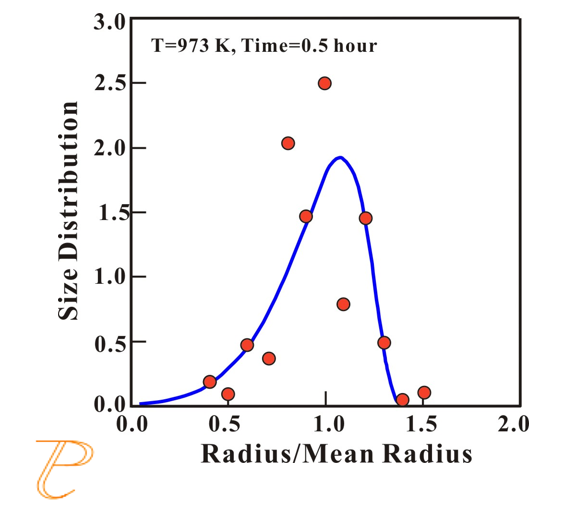
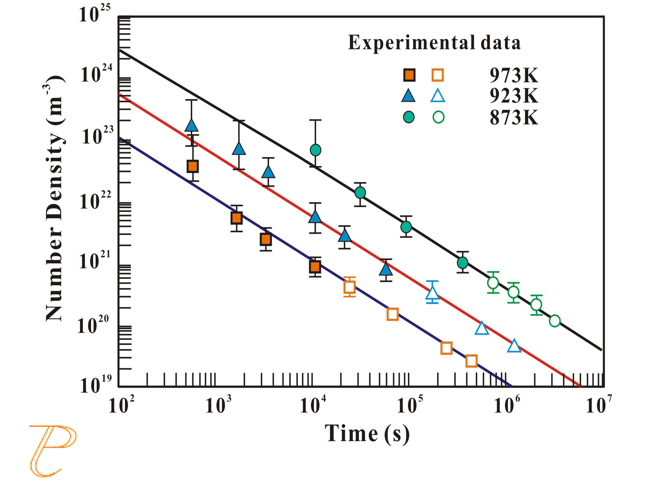
In this example, the precipitation simulation is carried out in Cu-0.68 at.%Co-1.52 at.%Fe alloy during the isothermal aging process at 973, 923, and 873 K. During the aging treatment, the fcc Co-Fe precipitates in (Cu) matrix. Based on the experimental observation, the shape of the particles could change from sphere to cuboid when the particles become large. Due to the absence of the cubic factor, the morphological evolution is ignored in the simulation. The normalized particle size distributions (PSD) for the 973 K precipitation at 0.5 h are simulated and compared with the measurements [2009Wat]. The number density at various temperatures are also obtained for the fcc Co-Fe precipitate in Cu-0.68 at.%Co-1.52 at.%Fe alloy. Good agreement between the predictions and measurements can be observed.
Figure 2: Comparison of the simulated particle size distribution of fcc Co-Fe precipitates in Cu-0.68 at.%Co-1.52 at.%Fe alloy annealed at 973 K for 0.5 h with the experimental data [2011Wat].
Figure 3: Simulated and experimental number density of fcc Co-Fe precipitate in Cu- 0.68 at.%Co-1.52 at.%Fe alloy annealed at 973, 923, and 873 K. The solid symbols are experimental data [2009Wat] for spherical particles; and the open symbols are for cuboid particles.
References
[2009Wat] D. Watanabe, C. Watanabe, R. Monzen, Determination of the interface energies of spherical, cuboidal and octahedral face-centered cubic precipitates in Cu-Co, Cu-Co-Fe and Cu-Fe alloys, Acta Metal. 57, 1899–1911 (2009).
[2011Wat] C. Watanabe, R. Monzen, Coarsening of δ-Ni2Si precipitates in a Cu-Ni-Si alloy, J. Mater. Sci. 46, 4327–4335 (2011).
[2018Tan] Y. Tang, Q. Chen, A. Engström, Kinetic simulations of diffusion-controlled phase transformations in Cu-Based alloys, In L.J. Zhang (Ed.), Modeling of diffusion-controlled phase transformation in alloys, Diffusion Foundation, Tans Tech Publications Ltd, 2018, pp. 1-22.
[2020Che] Q. Chen, Y. Tang, A. Engström, Developing Thermodynamic and Kinetic Databases for Cu–Based Alloy Design. J. Japan Inst. Copp. 59, 7–12 (2020).


