Running and Plotting the Moving Phase Simulation
These commands are the same as in the single-phase example.
@@simulate_reaction
sim
@@ post_processor
post
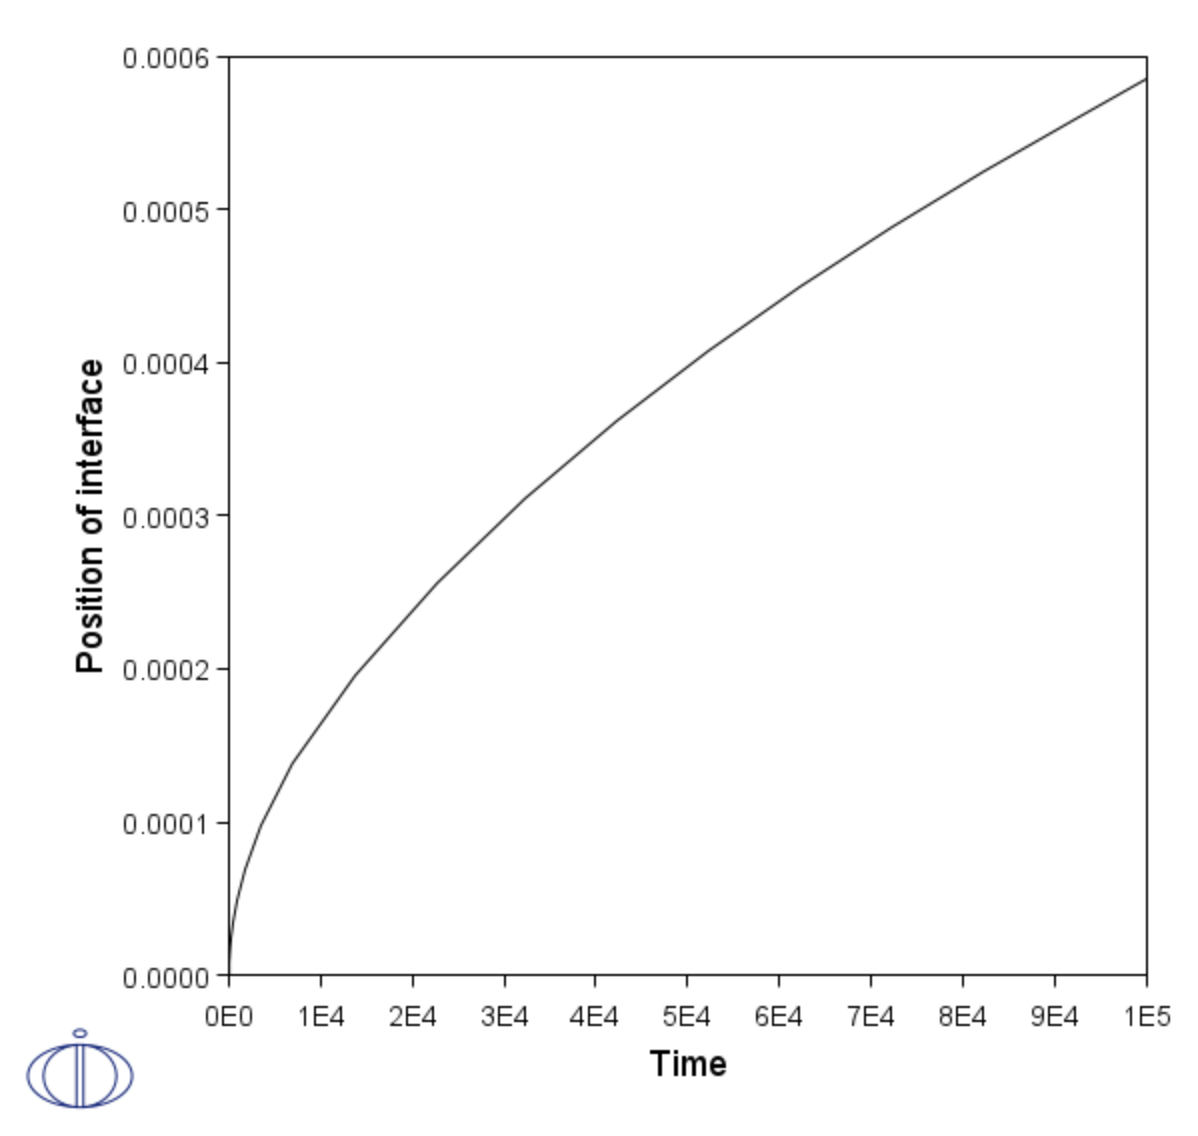
The ferrite/austenite phase interface position as a function of time is plotted.
Output from the example simple_moving_boundary showing the phase interface position as a function of time.
As mentioned in the single phase example, in general either a specific spatial position or a specific time must be set as a plot condition. Here the phase interface is set as plot condition and it can be referenced as the lower interface of the austenite region or as the upper interface of the ferrite region.
SET_PLOT_CONDITION
<TYPE OF PLOT CONDITION>
<FOR INTERFACE CONDITION, SPECIFY REGION>
<LOWER OR UPPER INTERFACE OF REGION>
set-plot-condition
interface
ferrite
upper
Set time as x-axis variable
@@set-diagram-axis x time
s-d-a x time
Now set the interface position as y-axis variable
s-d-a y
POSITION_OF_INTERFACE
<SPECIFY REGION>
<LOWER OR UPPER INTERFACE OF REGION>
pos-of-int ferrite upper
@@ plot_diagram
plot
The plot has the parabolic appearance characteristic for many types of diffusion simulations.
