PMET_03: Argon Oxygen Decarburization (AOD)
The Argon Oxygen Decarburization (AOD) process is a converter process applied in stainless steel making. In this process the oxidation of chromium in the steel melt needs to be prevented while carbon is oxidized. This is achieved by reducing the oxygen partial pressure by having a high Ar-content in the blowing gas. It is a highly exothermic process that requires adiabatic modeling. In this example the conversion of carbon-rich steel scrap is modeled together with additions of Ferronickel and Ferrochrome to a stainless steel. The example uses the Process Metallurgy Calculator.
Visit the website Application Examples → Process Metallurgy page for more background information as well as more in depth analyses of this and other examples. Also visit the Process Metallurgy Module page to access resources such as training videos, presentations, publications, webinars, and much more.
- Folder: Process Metallurgy
- File name:
PMET_03_Argon_Oxygen_Decarburization.tcu
This example requires a license to run the simulation. It works with TCS Metal Oxide Solutions Database (TCOX) versions 8 and newer.
Visualizations
Many of our Graphical Mode examples have video tutorials, which you can access in a variety of ways. When in Thermo‑Calc, from the menu select Help → Video Tutorials, or from the main My Project window, click Video Tutorials. Alternately, you can go to the website or our YouTube channel.
Open the example project file to review the node setup on the Project window and the associated settings on the Configuration window for each node. For some types of projects, you can also adjust settings on the Plot Renderer Configuration window to preview results before performing the simulation. Click Perform Tree to generate plots and tables to see the results on the Visualizations window.
When you run (Perform) this example, it takes a few minutes for the calculations to complete.
Background Description
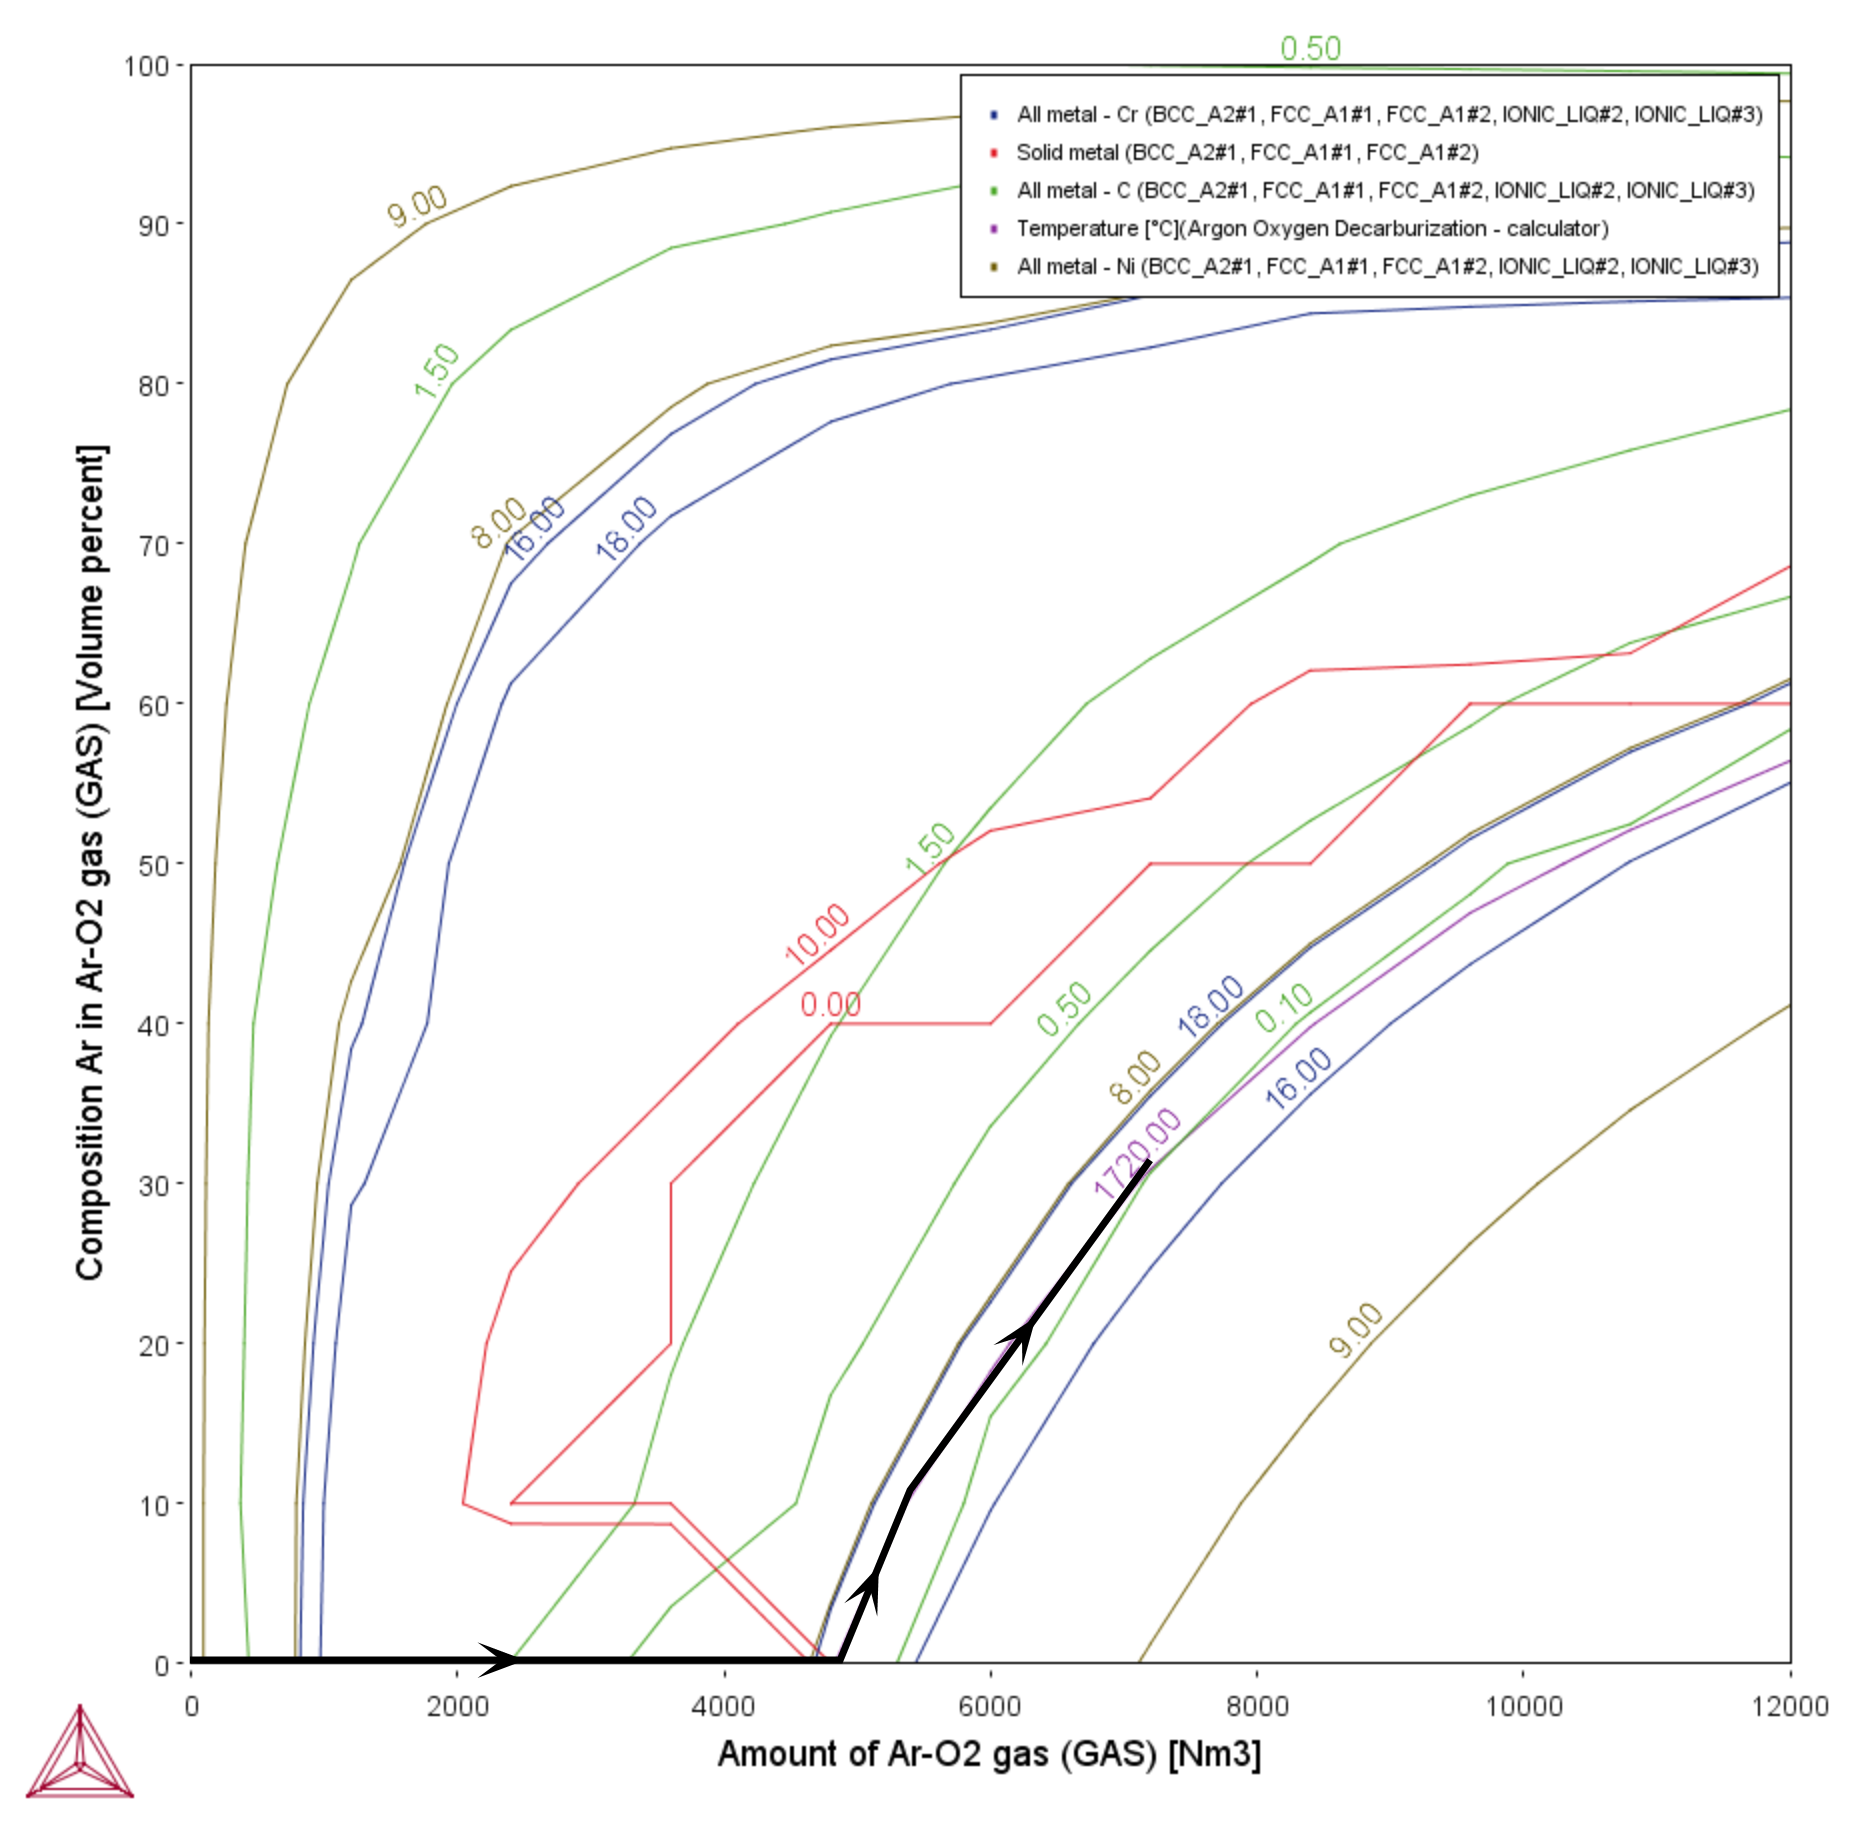
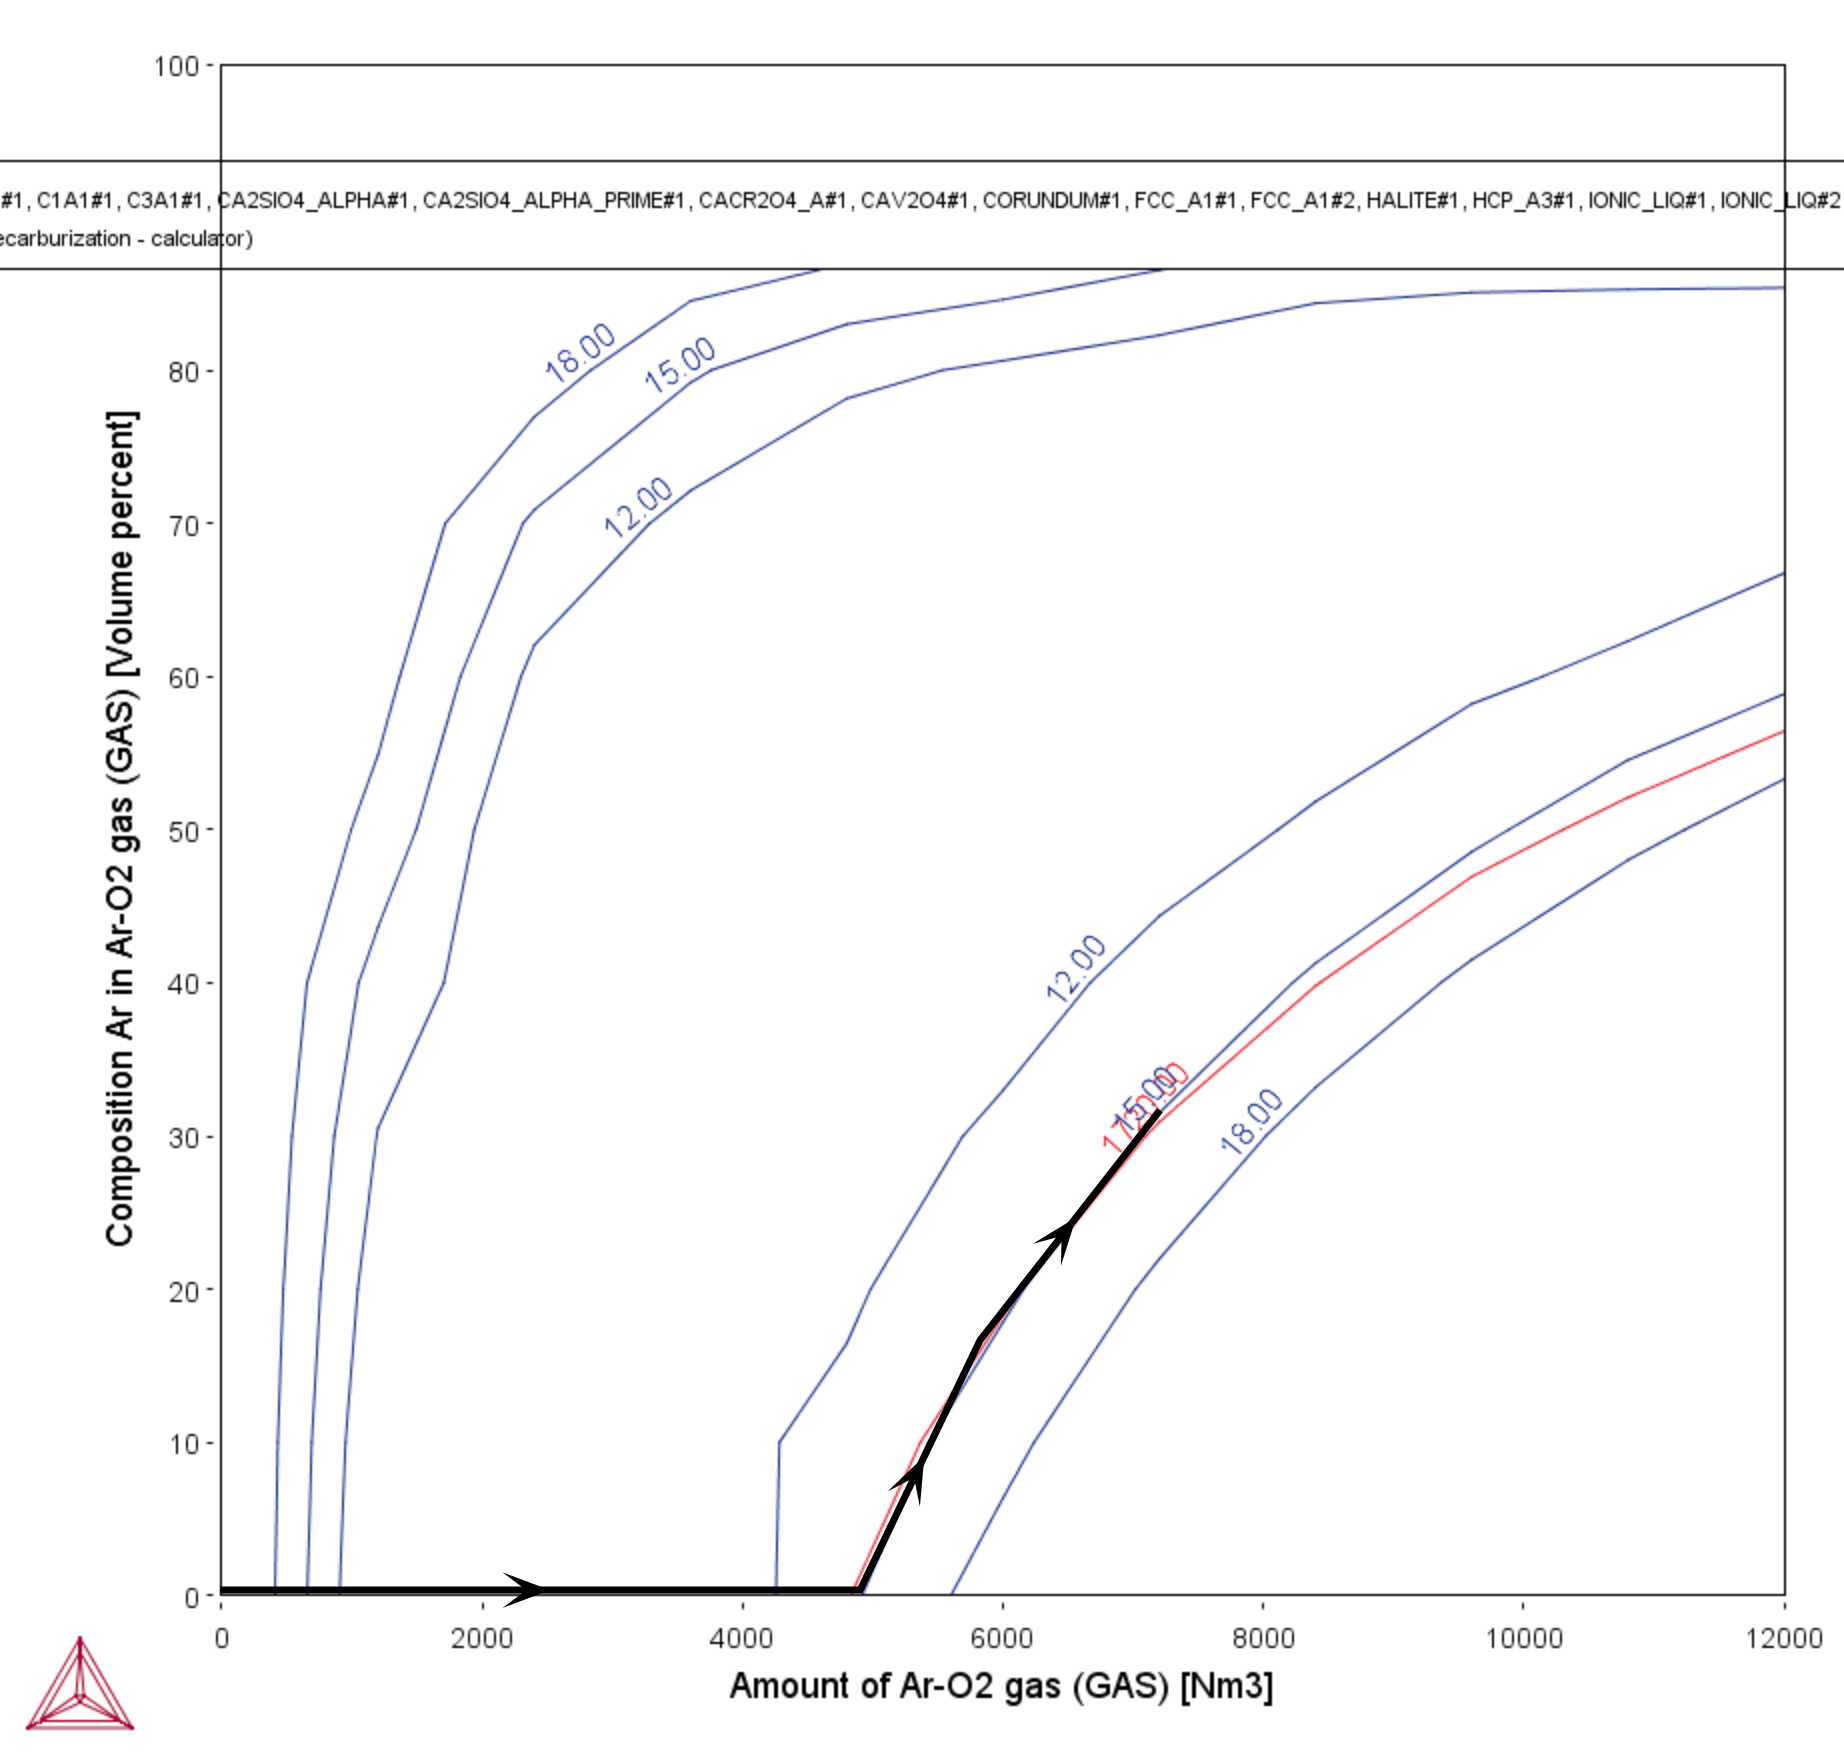
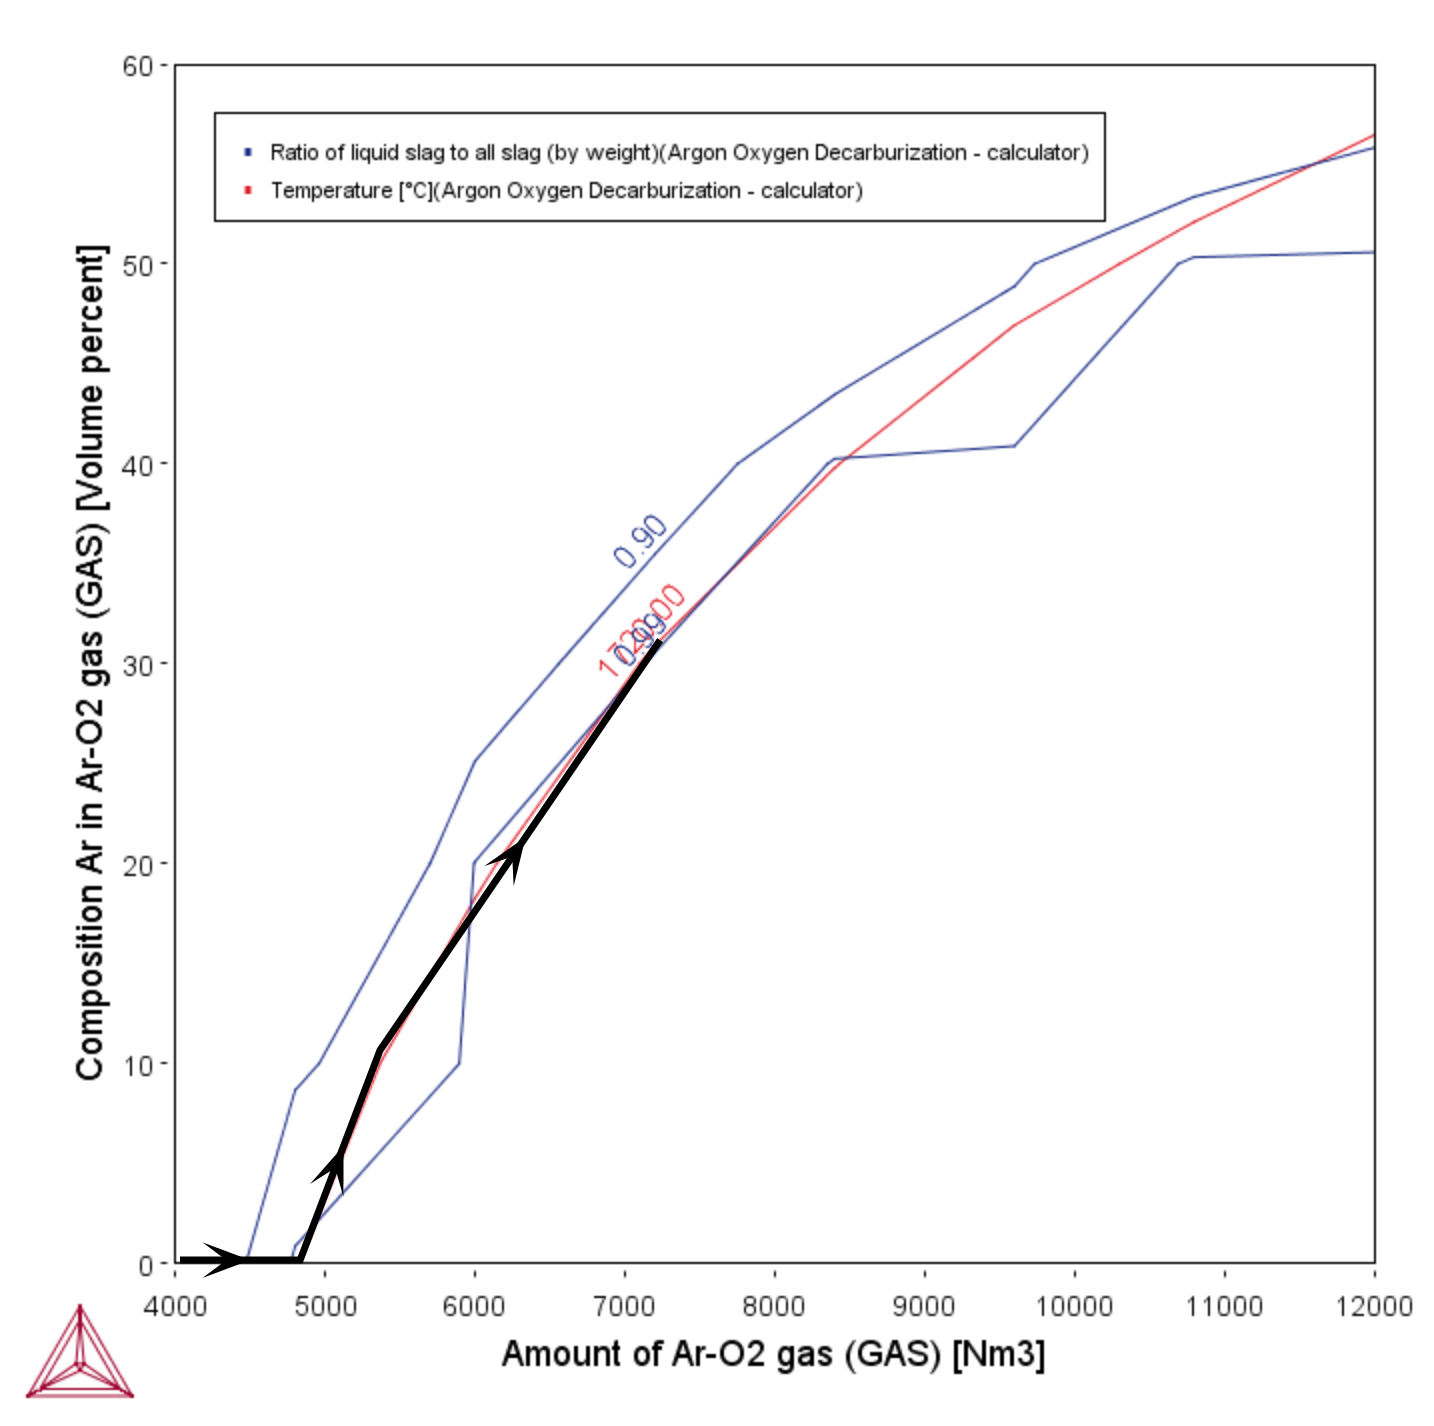
The AOD-process is characterized by an initially high O2-content of the blowing gas, which is gradually replaced by Ar. The maximum temperature of the process is typically around 1720 °C. A grid plot of an adiabatic calculation is well suited to model the required simultaneous change of amount of gas and its composition during this process. The black line in the plot above indicates a possible process control path that finally leads to suitable alloy composition close to a X5CrNi 18-10 stainless steel.
In principle, this plot could be used to control the blowing gas flow in a plant process. However, note that the simulation only considers a global gas phase, i.e. additional gas is added but never removed. This means that the given gas phase composition is an average one and not identical to the composition of the gas flowing in at each point in time. Additionally there is a certain impact on the resulting equilibria from the fact that all gas remains in the system and is not removed.
Slag Basicity
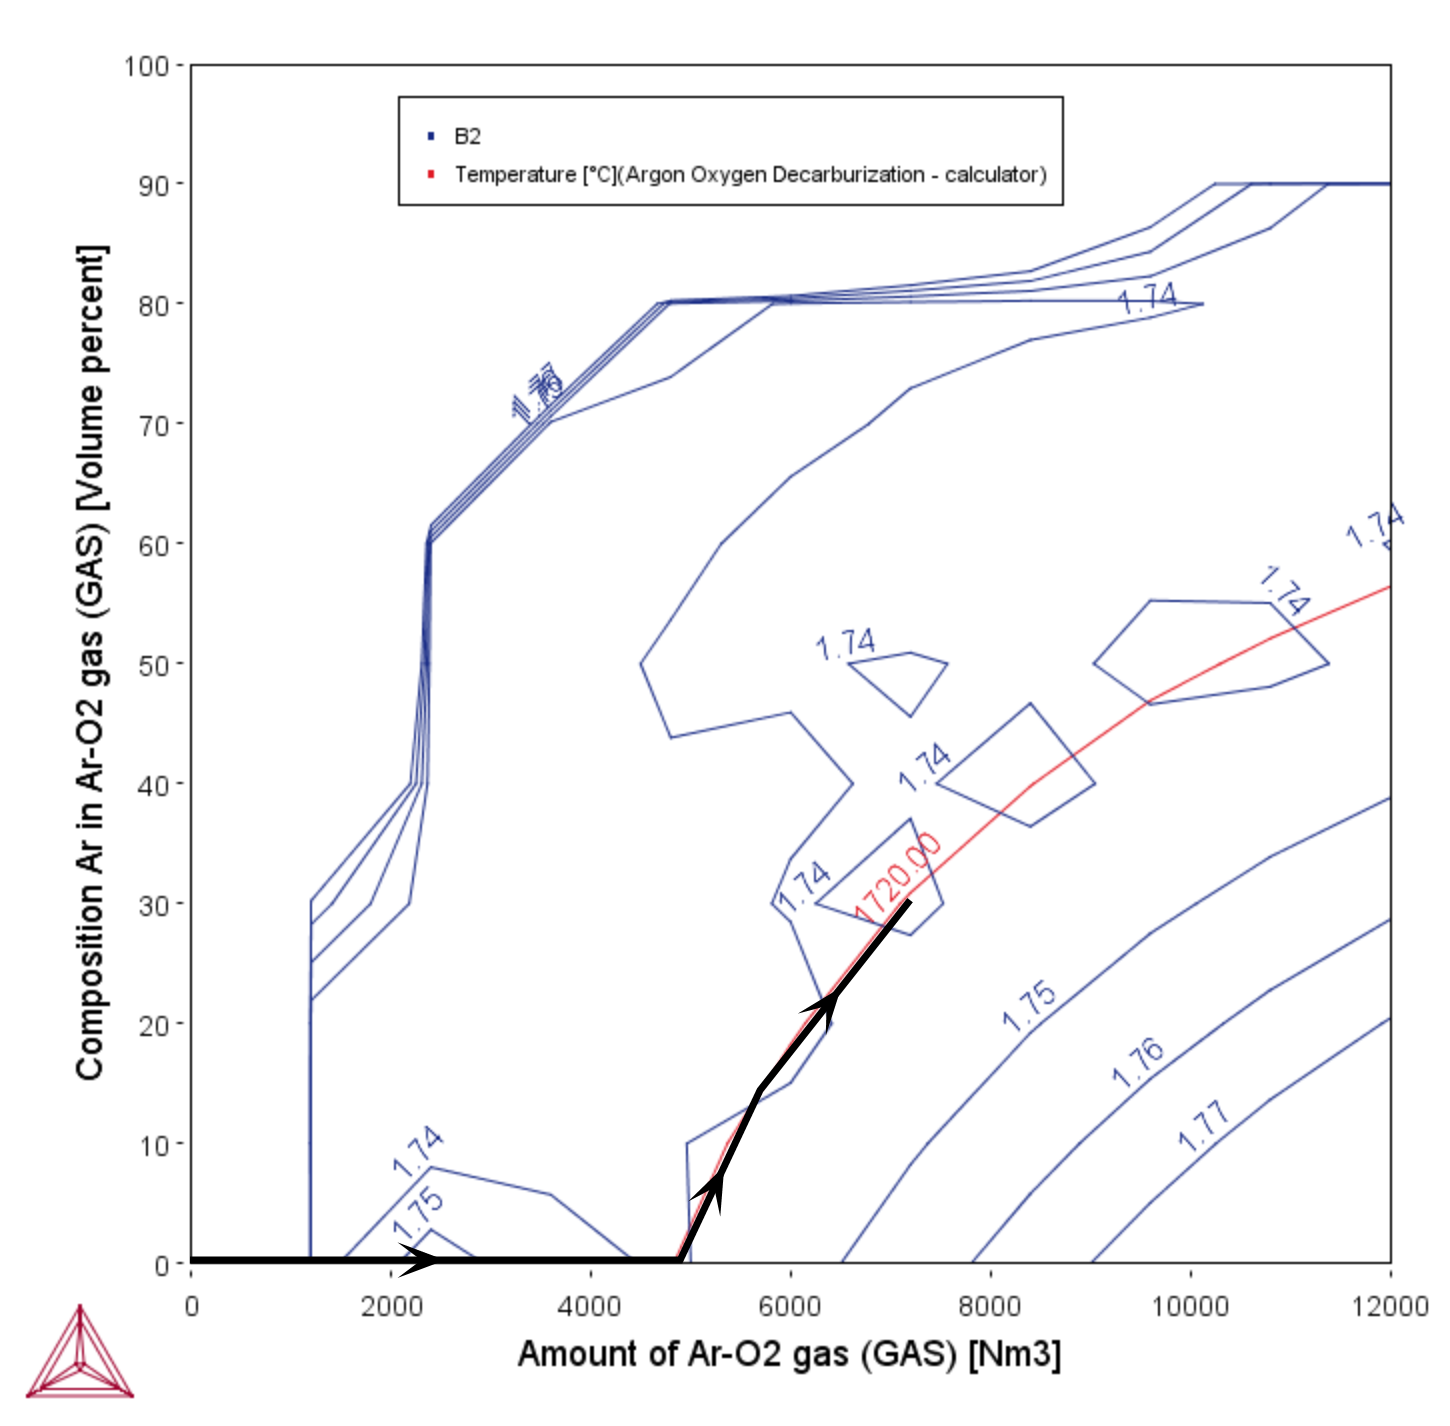
Figure 1: The Slag Basicity plot shows the basicity of the slag (which is a measure for the sulphur capacity of the slag). The process achieves a final basicity of 1.74 which is typical for an AOD-process. The black line in the plot indicates a possible process control path that finally leads to suitable alloy composition close to a X5CrNi 18-10 stainless steel.
S Content in Steel
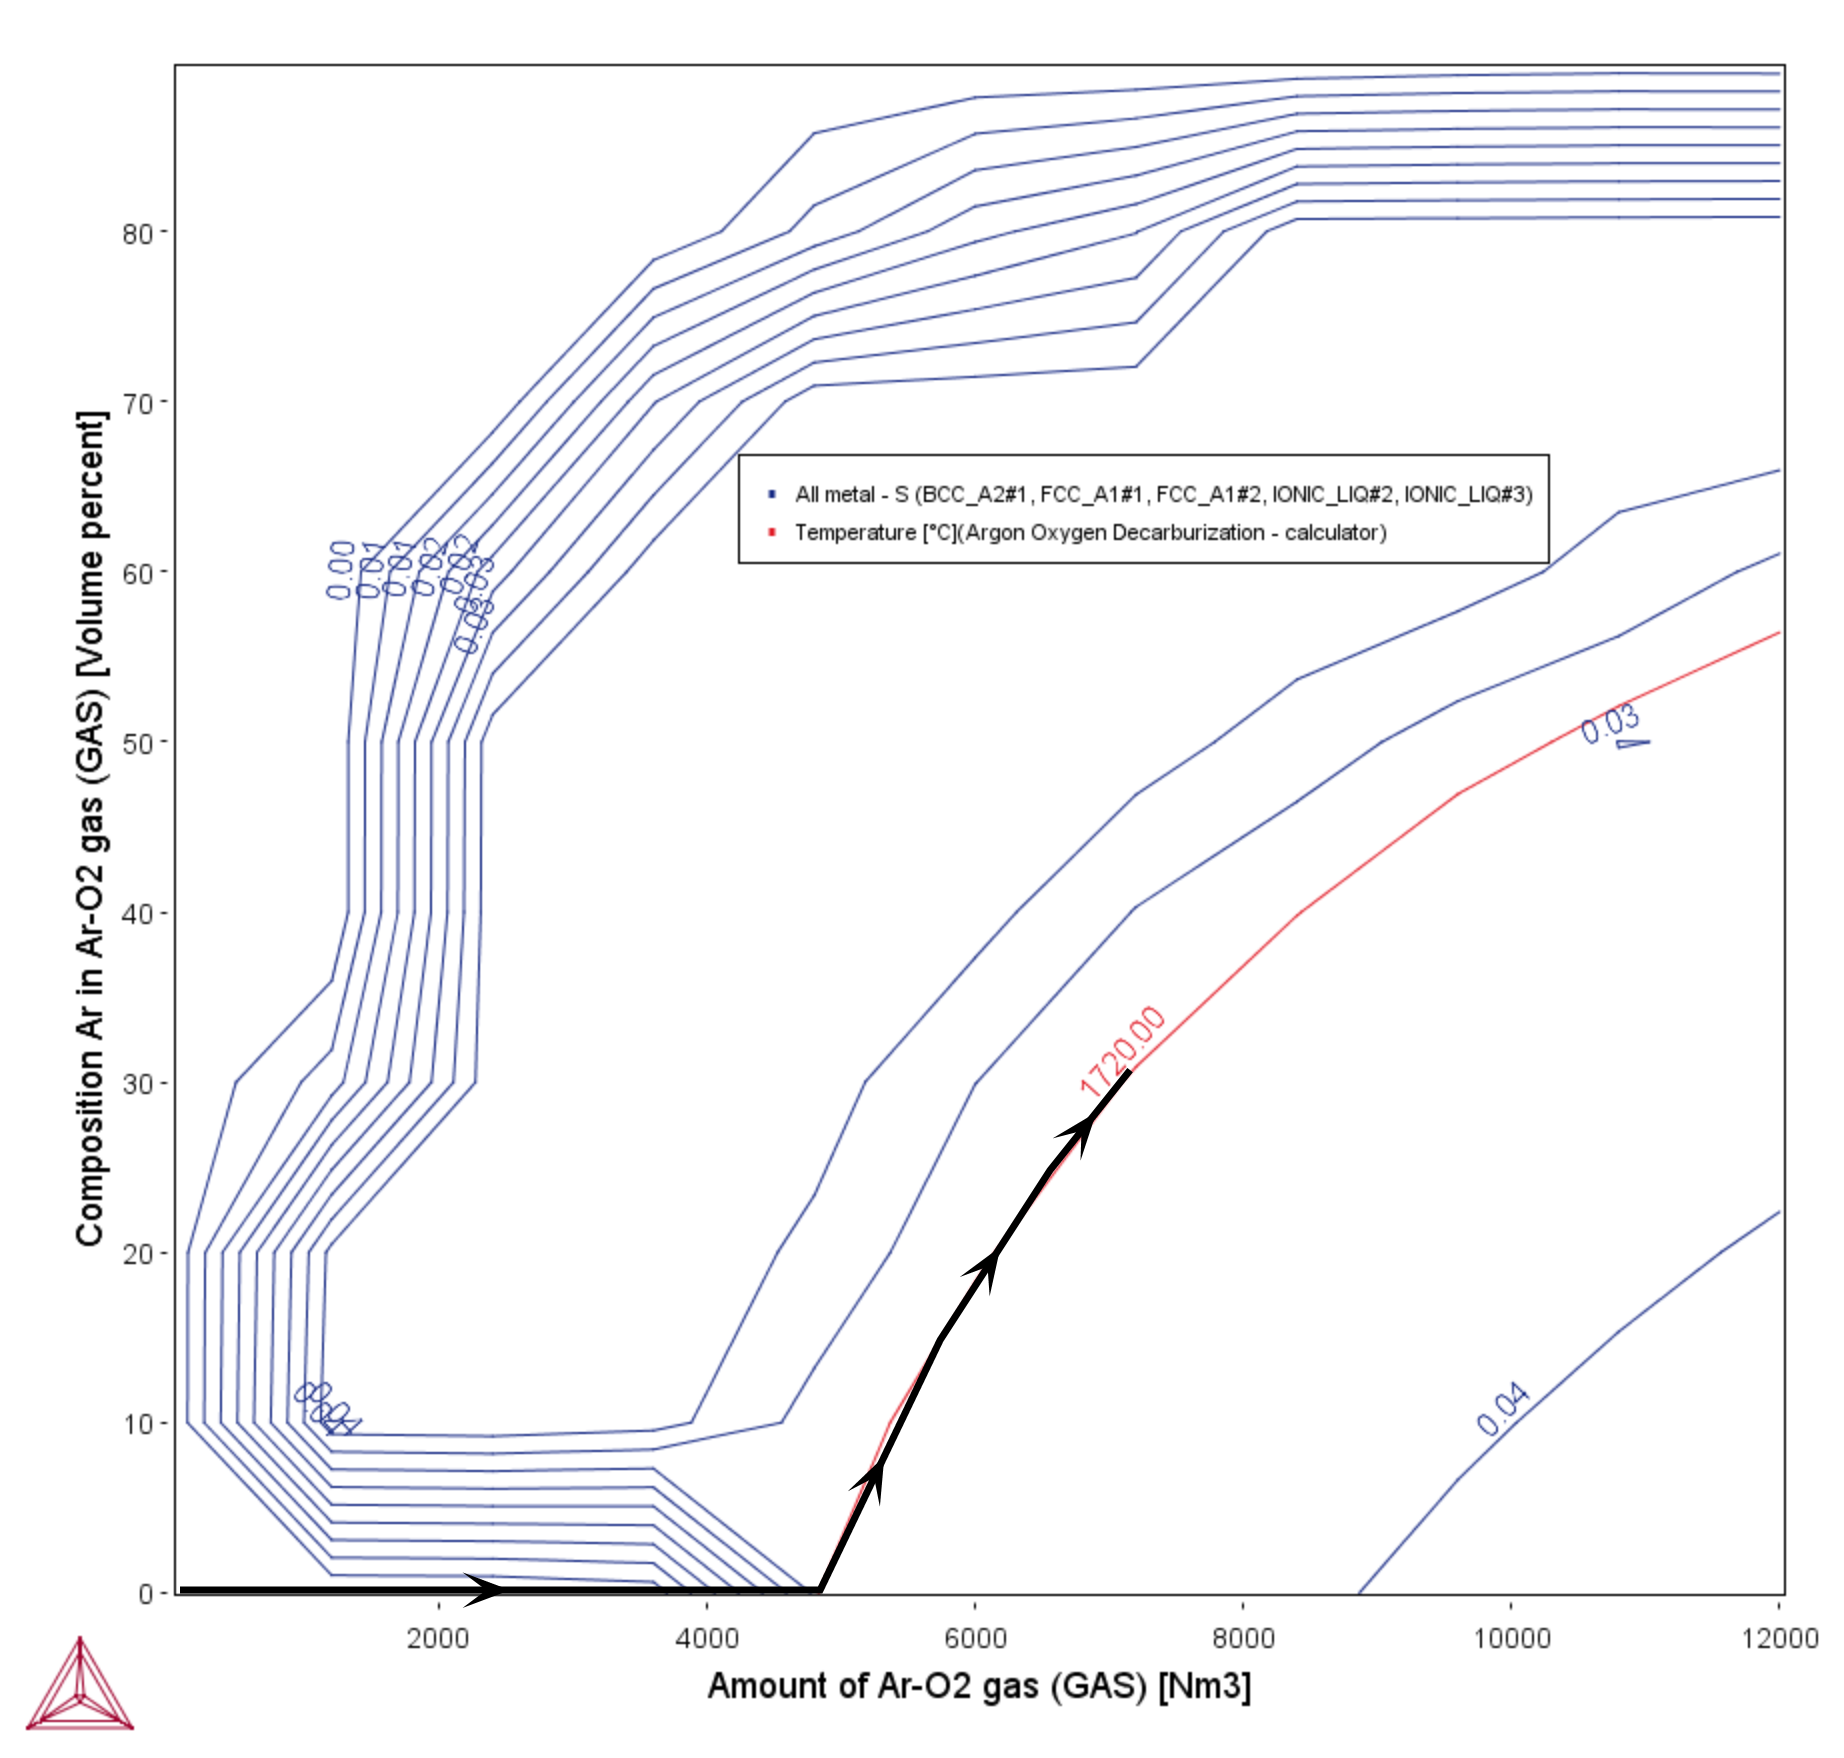
Figure 2: In the S Content in Steel plot, the sulphur content in the steel melt is slightly reduced during the process from 0.056% in the initial steel scrap to finally ca. 0.035%. The black line in the plot indicates a possible process control path that finally leads to suitable alloy composition close to a X5CrNi 18-10 stainless steel.
Cr Content in Slag
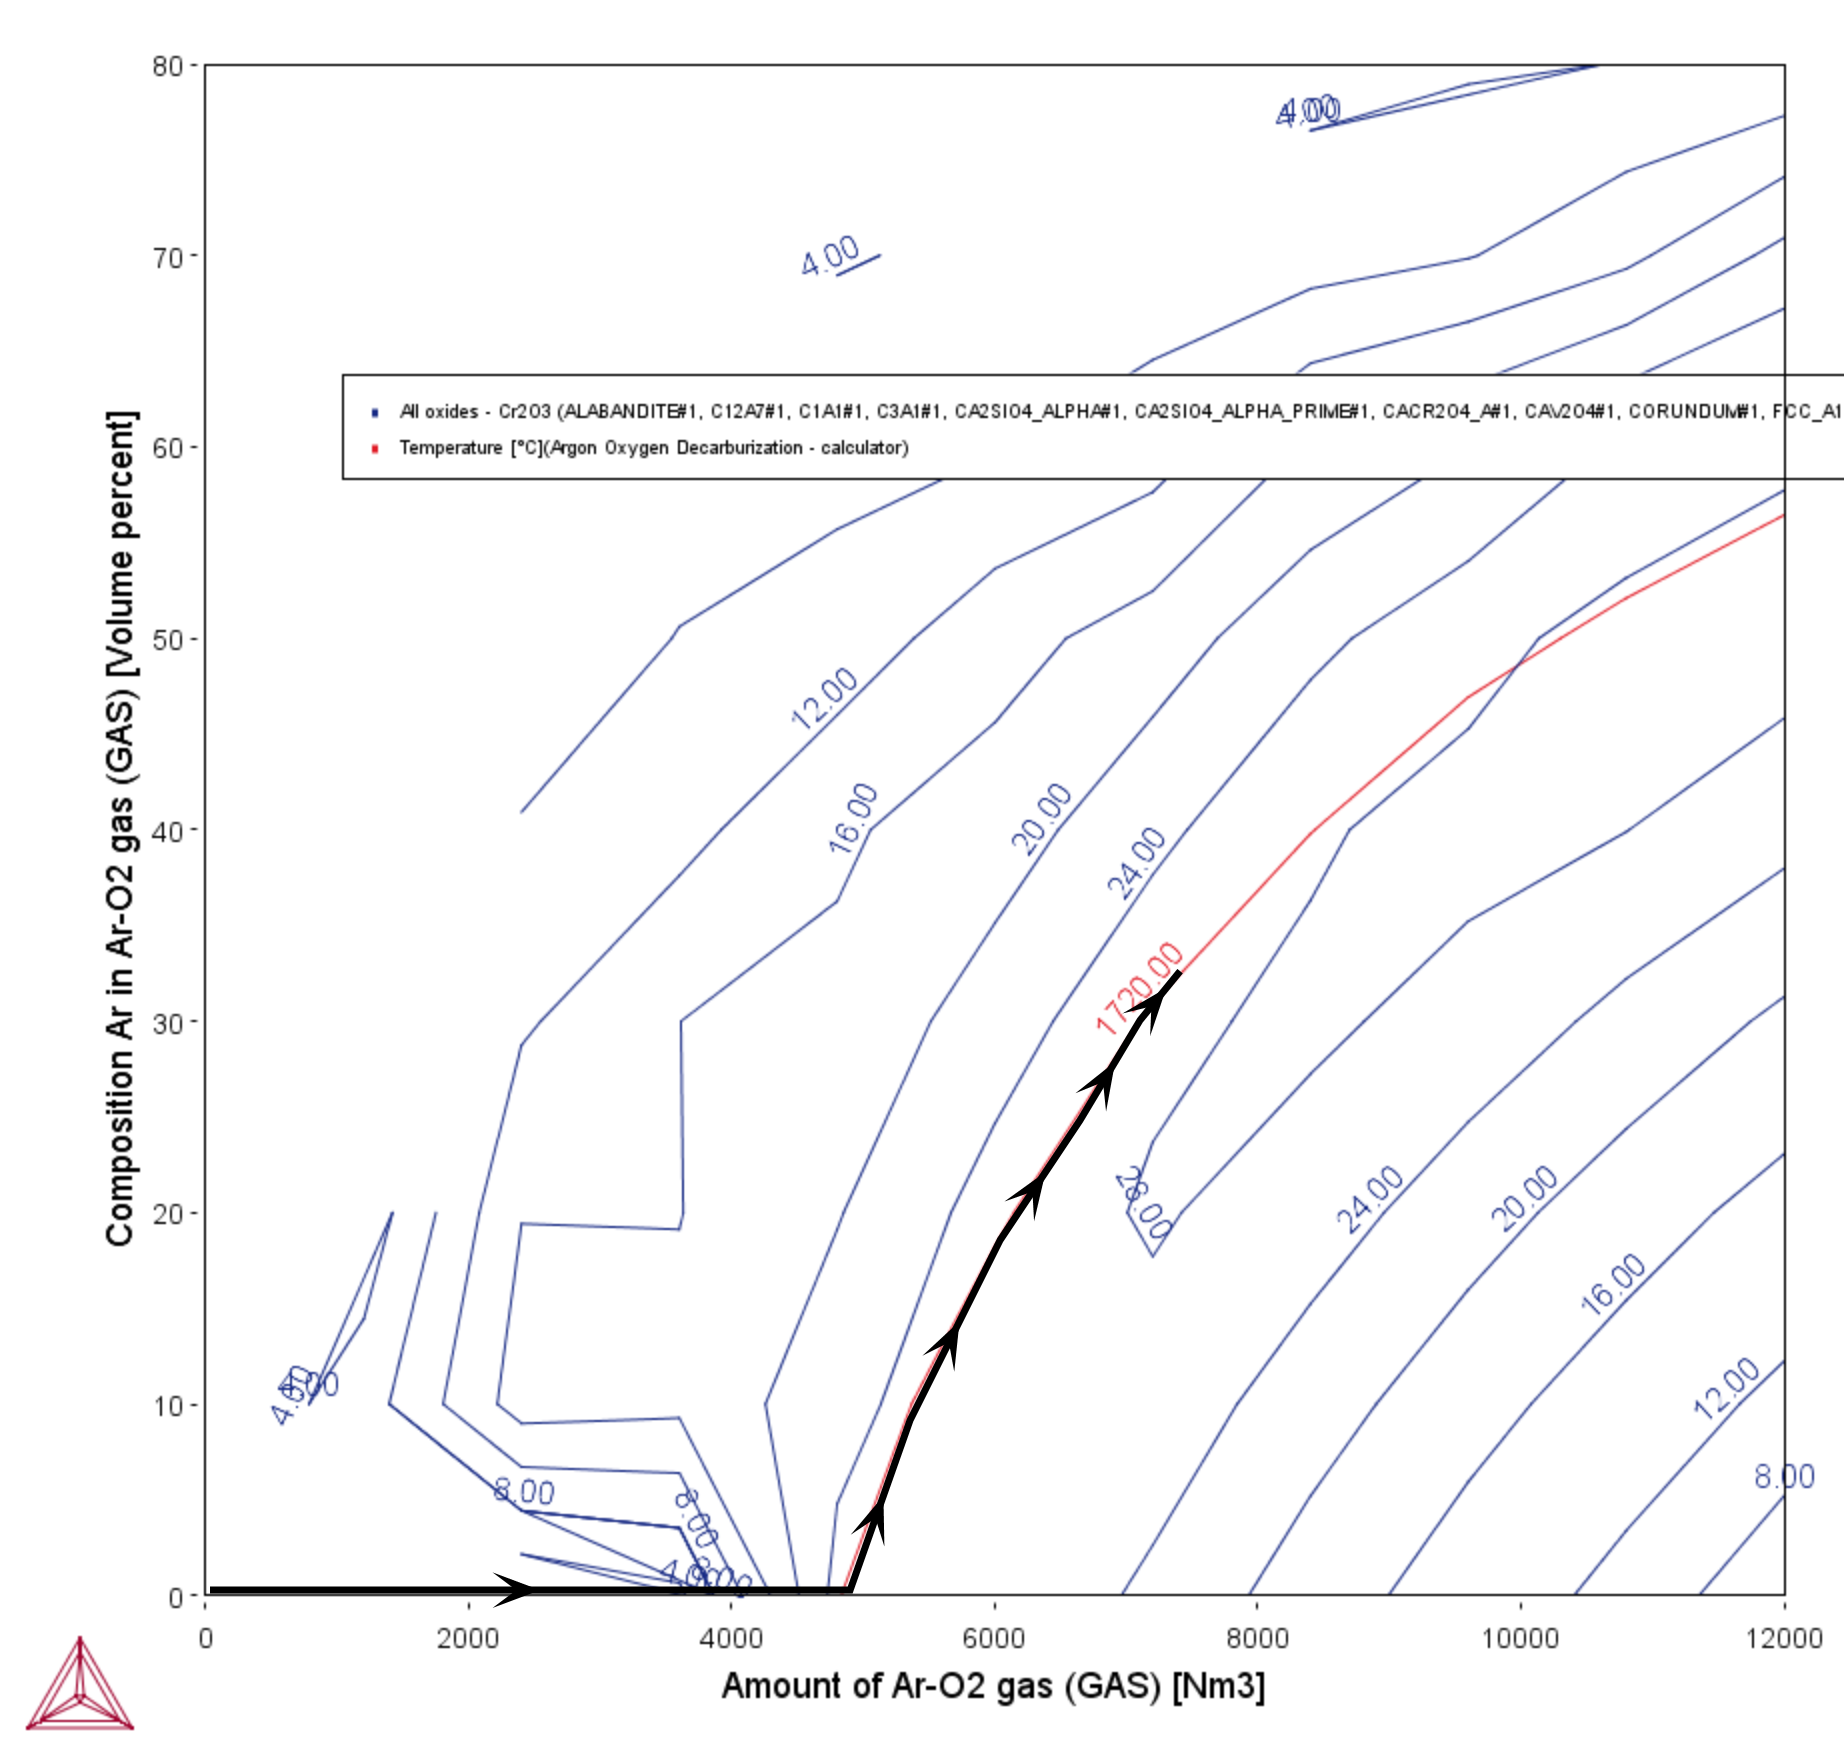
Figure 3: In the Cr Content in Slag plot, the Cr2O3-content in the slag reaches at the end of the process ca. 26 wt-%. This is typical for the AOD-process and requires an additional Cr-recovery step after the conversion to reduce the loss of chromium. The black line in the plot indicates a possible process control path that finally leads to suitable alloy composition close to a X5CrNi 18-10 stainless steel.
Amount of Slag
Figure 4: In the Amount of Slag plot, you can see that the process generates about 15 tons of slag in the total. The black line in the plot indicates a possible process control path that finally leads to suitable alloy composition close to a X5CrNi 18-10 stainless steel.
