PMET_05: Lab Scale Ladle Furnace (LF) Kinetics
Using the Process Metallurgy Calculator and the Process simulation branch, this example is based on the publication by Piva et al [2017Piv] where a lab scale sample of pure iron is first deoxidized with Si-Mn and then a synthetic top slag is added to the steel. Generally, by using the project file and the information below, you can get an idea about how to set up a ladle furnace simulation using the Process Metallurgy Module.
Visit the website Application Examples → Process Metallurgy page for more background information as well as more in depth analyses of this and other examples. Also visit the Process Metallurgy Module page to access resources such as training videos, presentations, publications, webinars, and much more.
Setting Up a Process Metallurgy Simulation
Defining the Process Simulation
Visualizations
Open the example project file to review the node setup on the Project window and the associated settings on the Configuration window for each node. For some types of projects, you can also adjust settings on the Plot Renderer Configuration window to preview results before performing the simulation. Click Perform Tree to generate plots and tables to see the results on the Visualizations window.
When you run (Perform) this example, it takes a few minutes for the calculations to complete.
About the Plot Results
Many different aspects of the reactions taking place in the LF can be plotted and analyzed. After you run the project file and obtain the plots, you can experiment by adjusting the settings on each Plot Renderer to see what happens in each case. There is more analysis about this and other examples available at the links to our website.
For an example of a more realistic industry scale, see PMET_06: Ladle Furnace (LF) Kinetics.
Setting Up the LF Process Simulation
In the paper by Piva et al. [2017], it is experimentally investigated how the steel and inclusion composition changes in function of time as the Si-Mn killed steel reacts with the slag. This experiment can serve as a model for the production of SiMn killed steel with subsequent top-slag deoxidation.
![Sketch of the experiment performed by Piva et al. [2017]. Sketch of the experiment performed by Piva et al. [2017].](../../resources/images/pmet/examples/pmet05_sketch.png)
Figure 1: Diagram of the experiment performed by Piva et al. [2017]. The sequence as described in the text is: (1) liquid Fe with dissolved oxygen; (2) FeMn and SiMn added to deoxidize Fe; (3) top slag added after 360s; and (4) gradual reaction between steel, slag and inclusions.
According to the publication the following reaction sequence is expected as shown in the diagram:
- In the initial state the steel contains 400 ppm of dissolved oxygen.
- The deoxidizing agents are added. They dissolve and react with the oxygen in the steel forming oxide inclusions, thereby reducing the amount of dissolved oxygen ("killing" the steel). The kinetics are fast, and it can be assumed that the reaction proceeds to thermodynamic equilibrium.
- On adding the slag (360 s after step 2, killing the steel) the liquid steel starts reacting with the slag.
- According to the authors the most important reaction that takes place is the dissolution of Al out of the slag and its transferal into the liquid steel, where it reacts with the inclusions and changes their chemistry. Flotation of the inclusions is assumed to be negligible, due to the small size of the crucible and lack of stirring.
In this example only the last reaction is simulated after adding the slag. The kinetic parameters, compositions of all materials and process schedule are all taken from the publication.
Results and Experimental Analysis
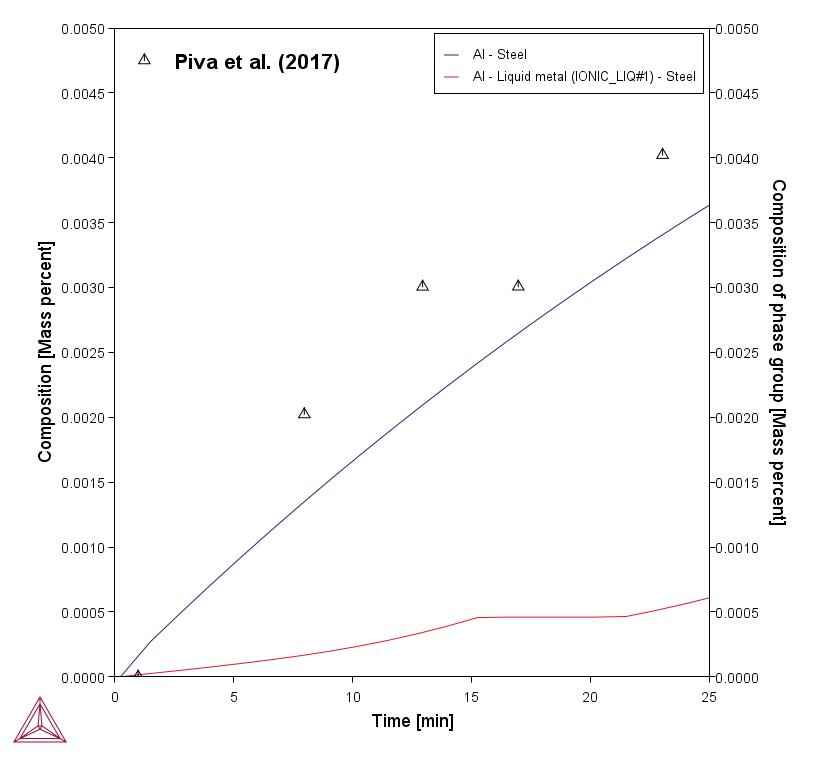
The plots below compare the Al content in the liquid steel with the experimentally determined amount. The bottom plot shows how the Al2O3 from the slag phase is gradually reduced to metallic Al that dissolves in the liquid steel.
In this example, only part of the Al in the liquid steel is dissolved as metallic Al. With the Process Metallurgy Module, it is possible to plot both dissolved Al and also total Al.
In the steel industry this fraction of Al in the liquid steel is often termed dissolved Al. The rest of the Al reacts with the oxygen in the liquid steel and forms oxide inclusions. The amount of dissolved Al plus the Al bound up in oxide inclusions is often termed total Al. The difference between total Al minus dissolved Al is an important measure for the steel cleanness.
Total Al is what was measured by Piva et al. [2017] and their experimental data are compared to the calculated values below.
Figure 2: Total Al in the steel compared with experimental data (blue/top curve). Additionally the amount of dissolved Al is plotted (red/bottom curve), this is done by selecting “Composition of phase group” and “Liquid metal”. Note that the red/bottom curve is not available with the example.
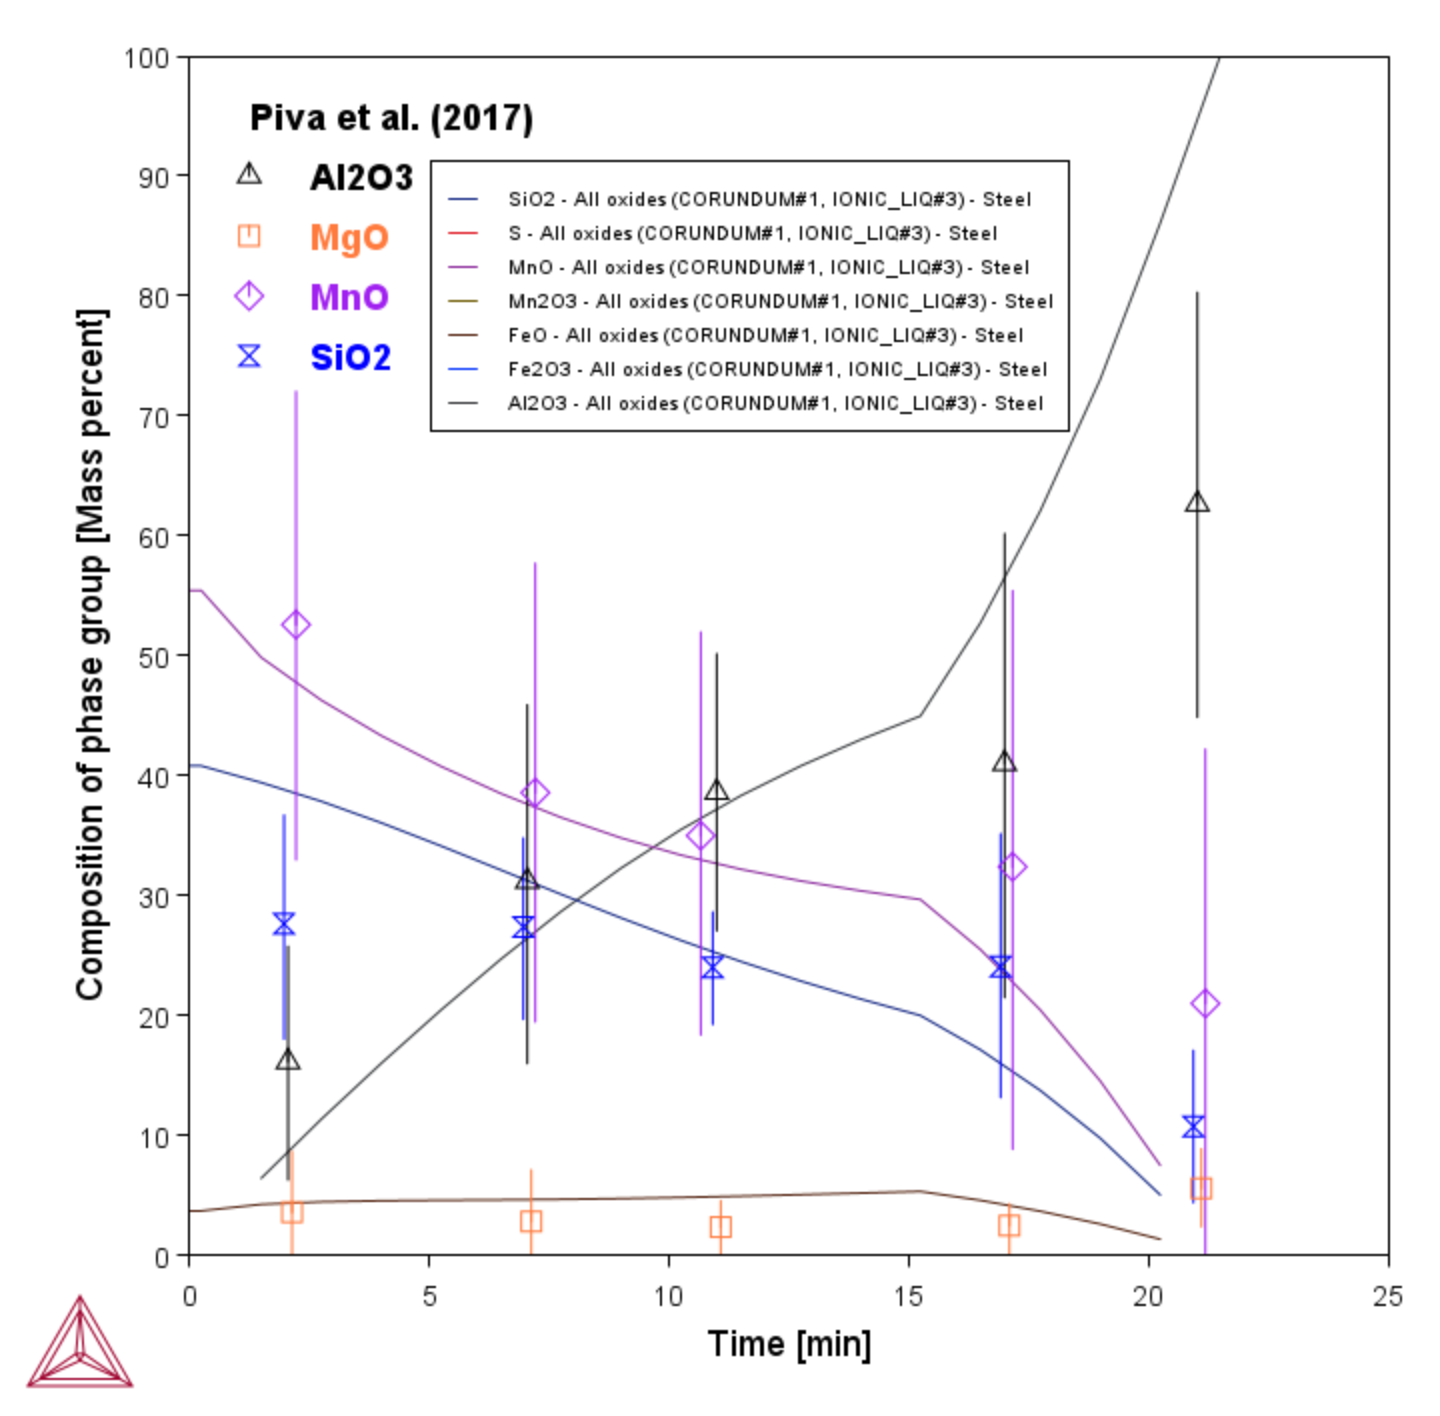
Immediately after killing the steel with SiMn and FeMn, the liquid steel contains liquid Si‑Mn‑oxide inclusions only. As the liquid steel picks up Al from the slag phase in function of time, the inclusions get richer and richer in Al. This experimentally verified change in inclusion chemistry is well reproduced by this simulation.
In the experiment, only the average composition of all inclusions could be measured; the type of inclusion (liquid / solid) was not determined.
Figure 3: Calculated composition of non-metallic inclusions in function of processing time compared to experimental data [2017Piv].
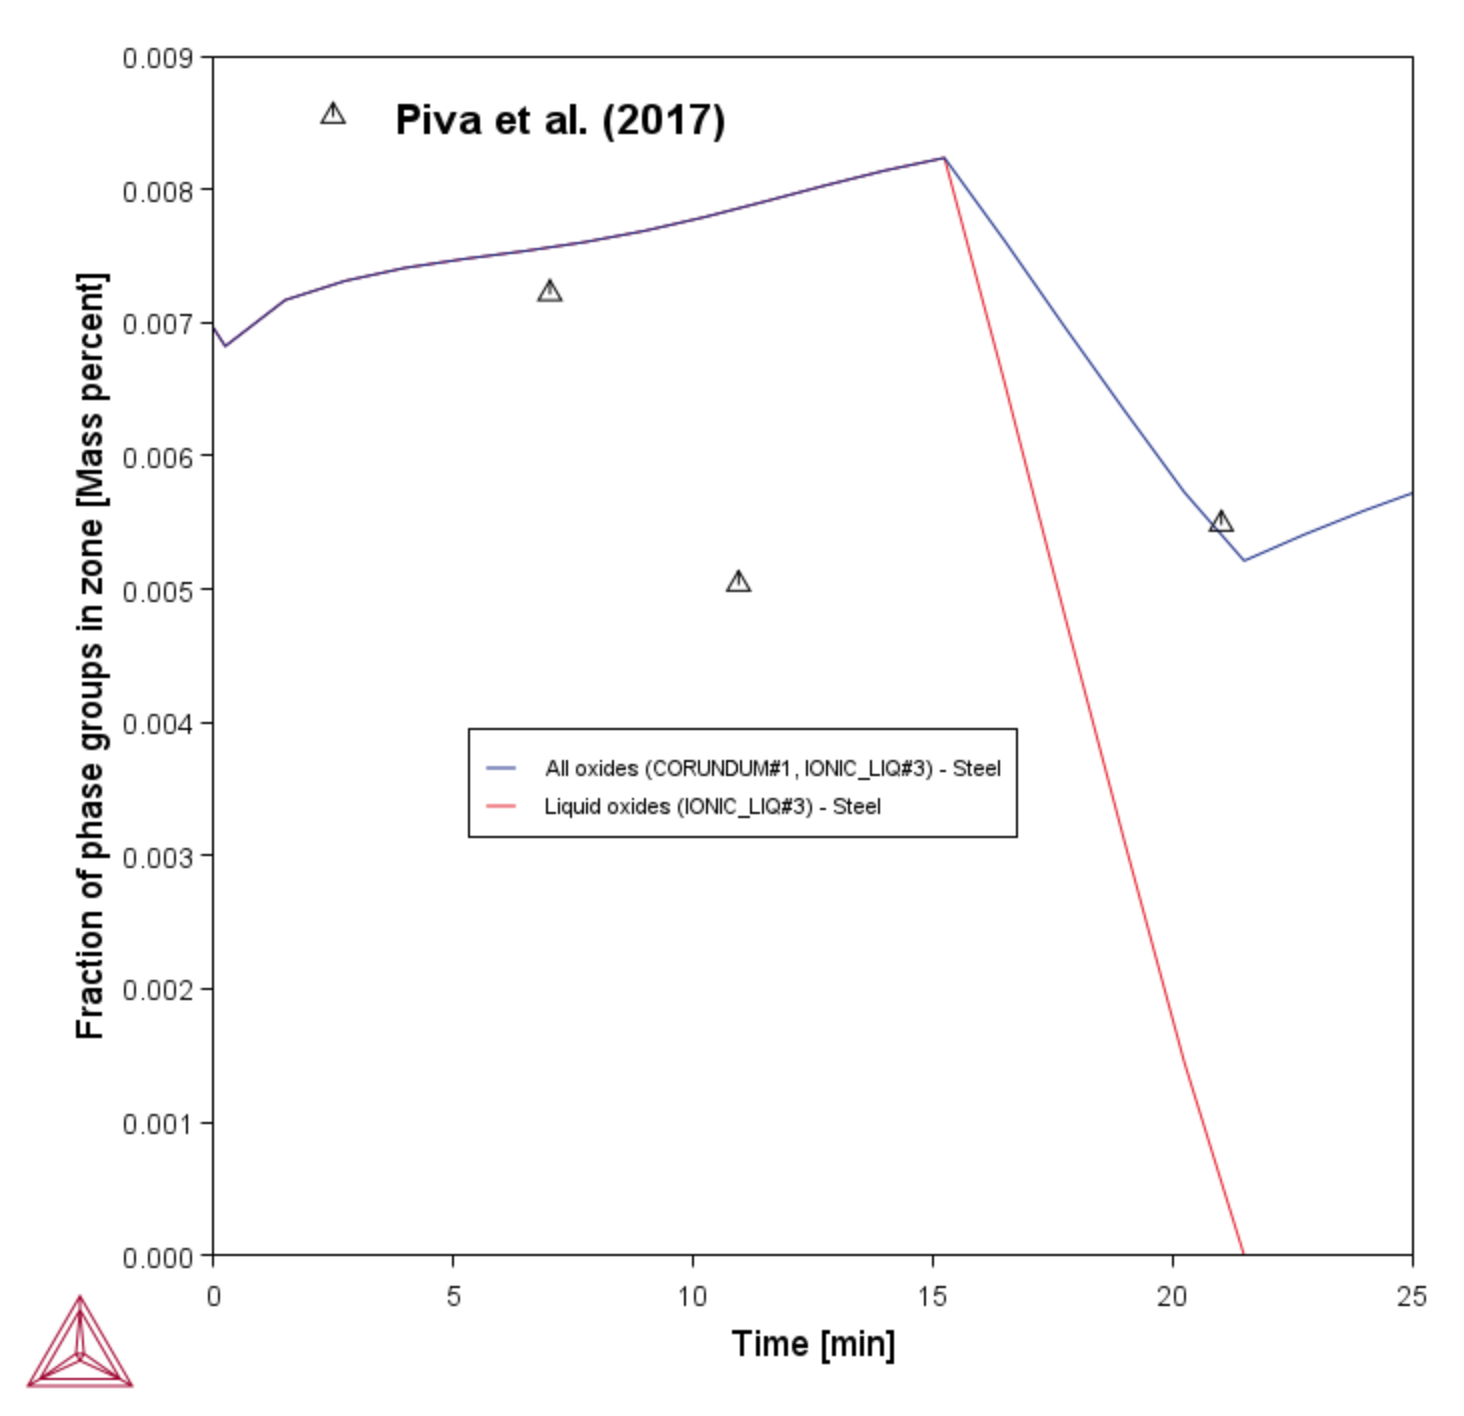
With this simulation it is also possible to calculate the amount and type of inclusions present in the liquid steel. At the beginning of the process all the inclusions are liquid oxides, that gradually get richer in Al2O3 as the steel picks up Al from the slag. After 20 minutes processing time, the first solid corundum (Al2O3) inclusions start appearing. After 25 minutes almost no liquid inclusions remain.
Figure 4: Amount of inclusions in the liquid steel in function of processing time. The total amount of inclusions (red line) and liquid oxide inclusions (blue line) are plotted. Up to about 20 min all inclusions are liquid oxide type, then they are replaced by solid corundum (Al2O3) inclusions. Experimental data from [2017Piv].
Reference
[2017Piv] Piva, S. P. T., Kumar, D. & Pistorius, P. C. "Modeling Manganese Silicate Inclusion Composition Changes during Ladle Treatment Using FactSage Macros," Metall. Mater. Trans. B 48, 37–45 (2017).


