Viscosity: Fe-Ni, Cr-Ni, and Cr-Fe-Ni
The viscosity thermophysical property data is included with TCS Ni-based Superalloys Database (TCNI) starting with version 10 (TCNI10).
Fe-Ni
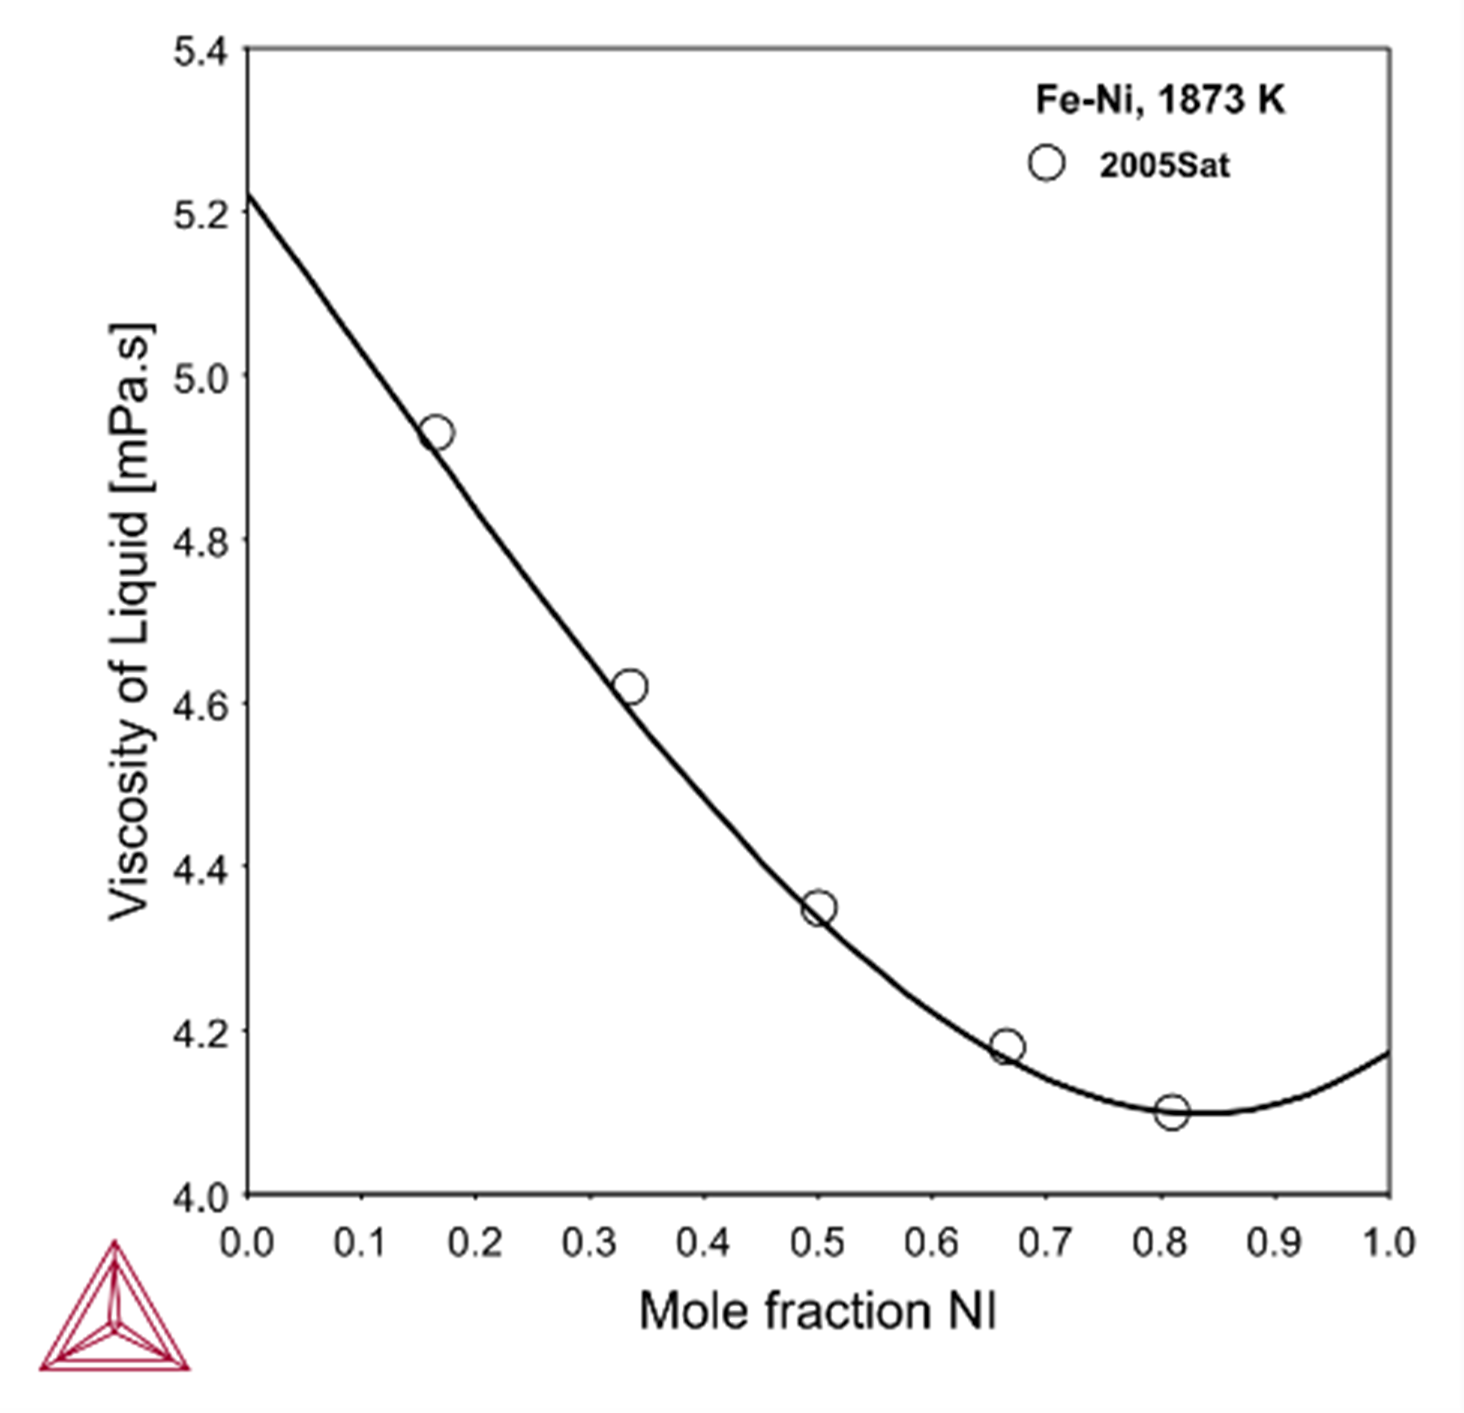
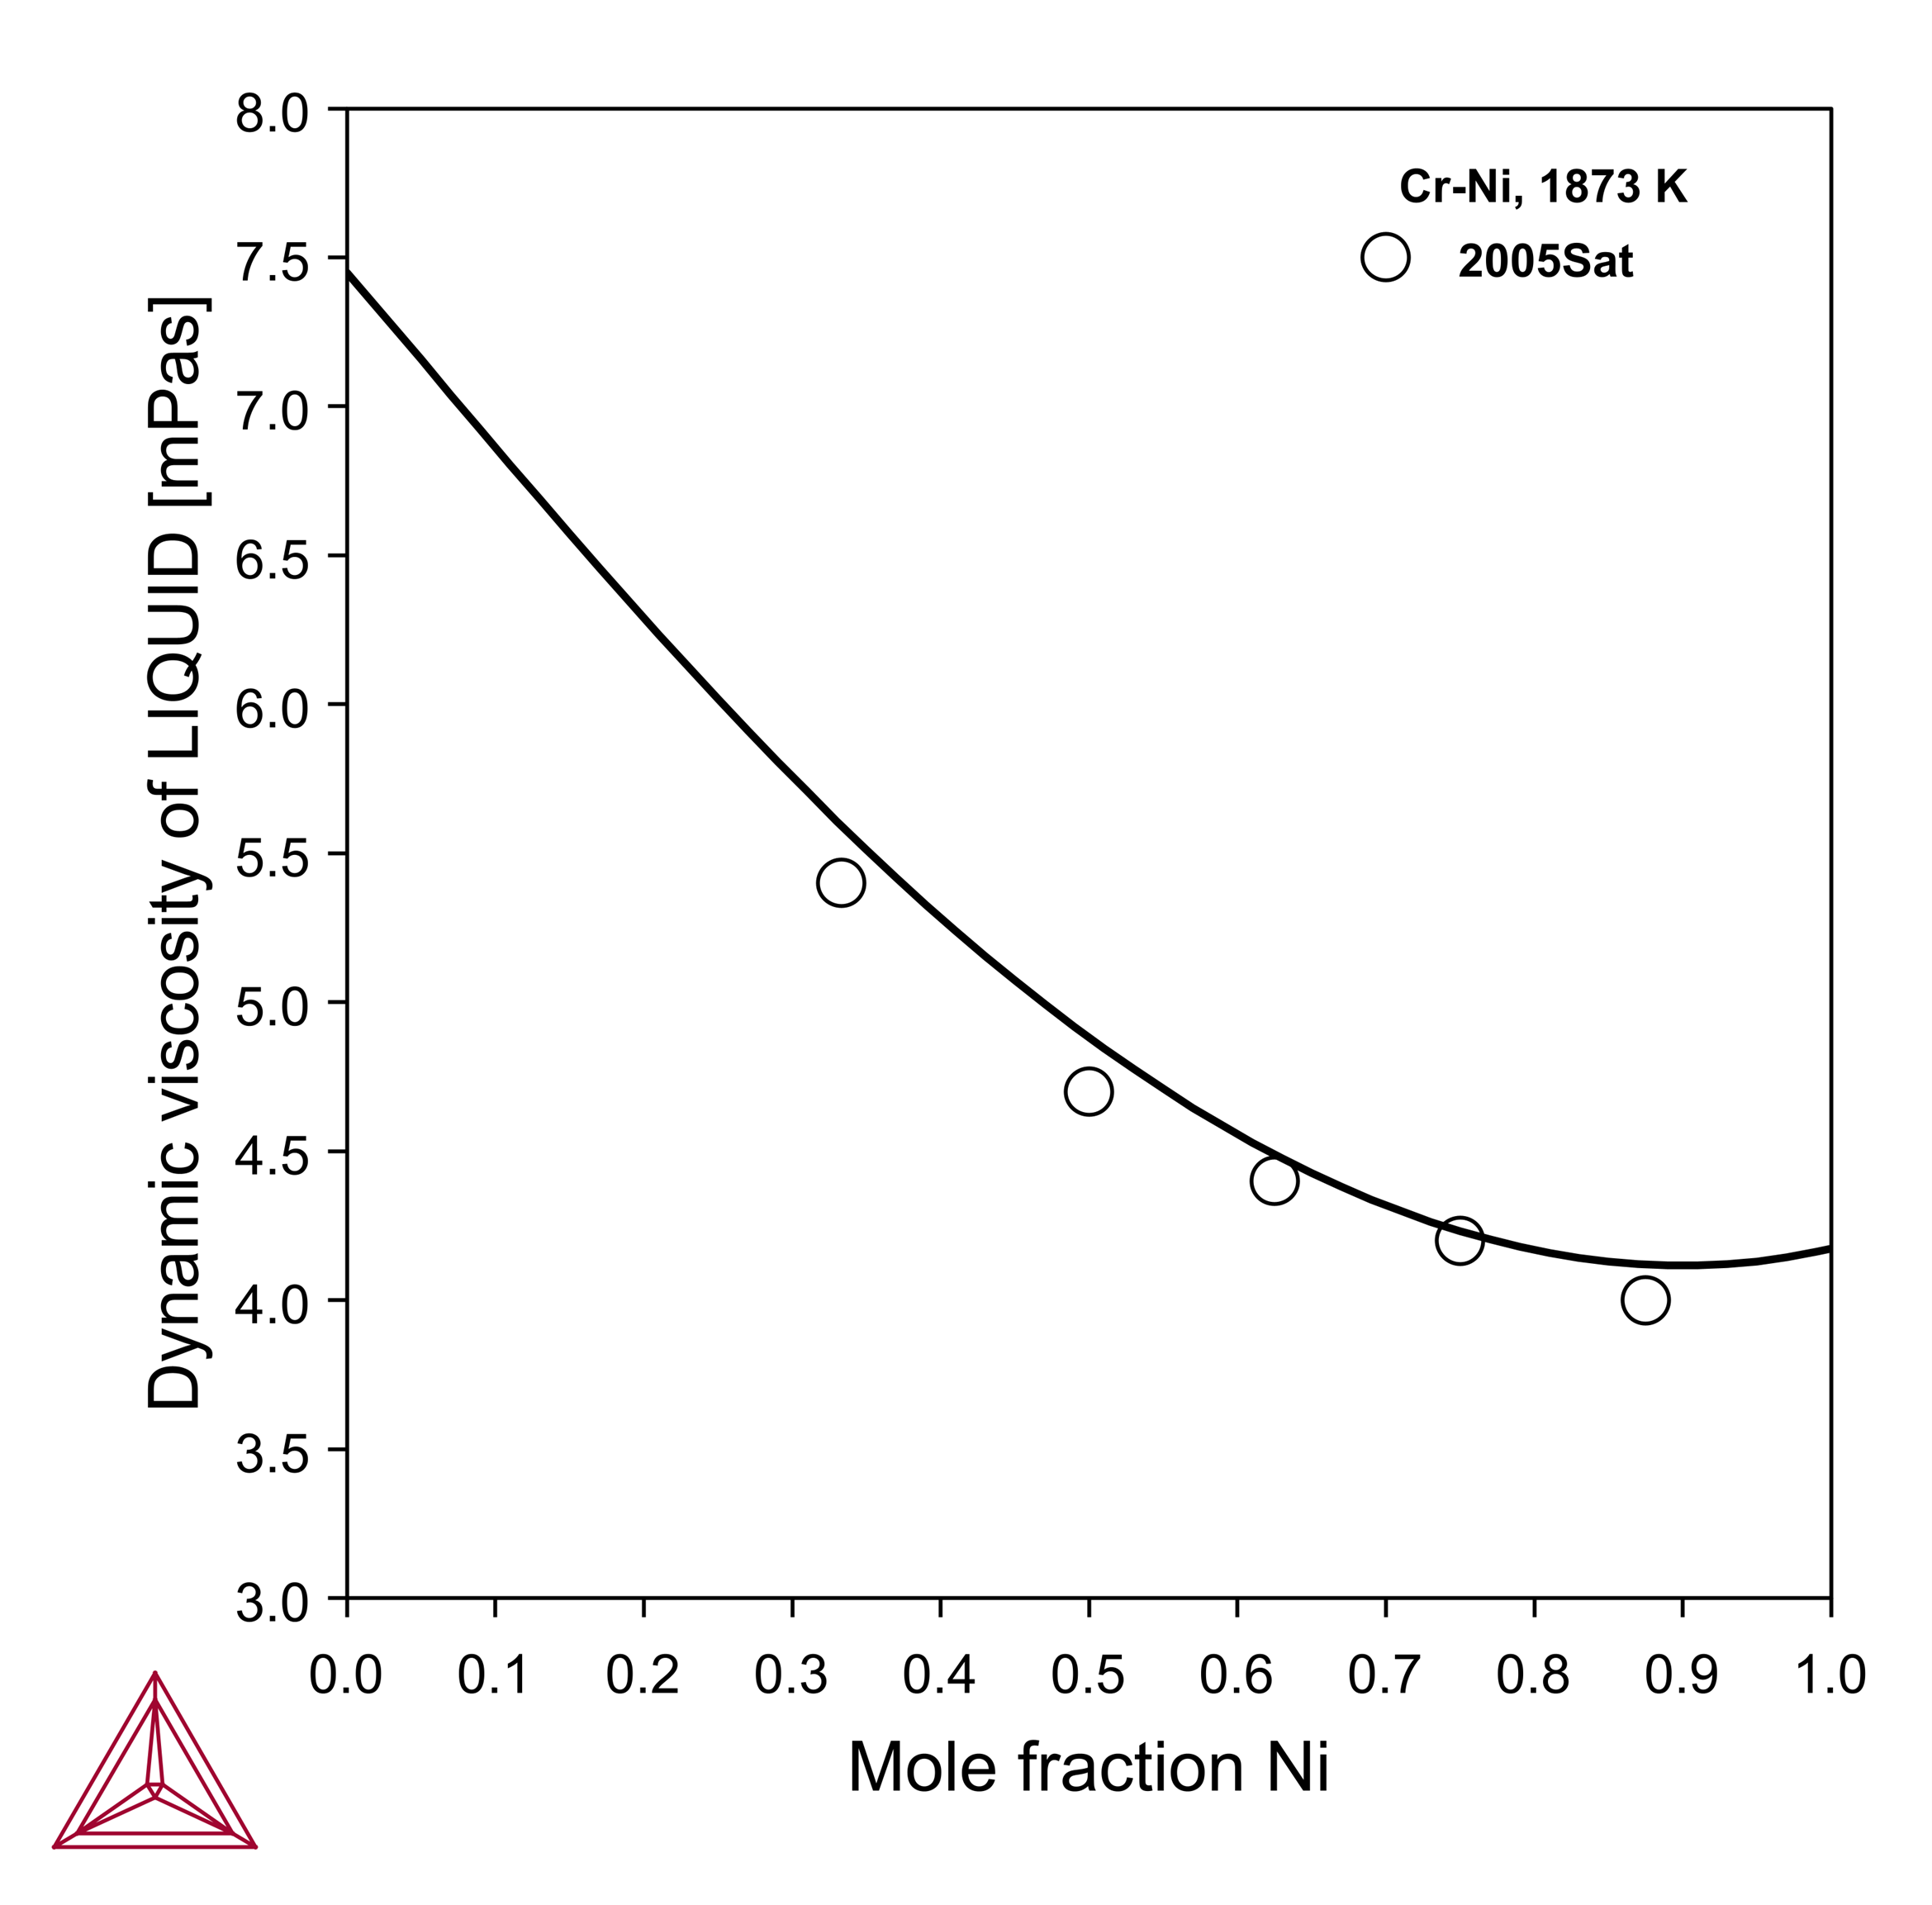
The calculated dynamic viscosity plots of Fe-Ni and Cr-Ni binary systems at 1873 K are shown.
Cr-Ni
Cr-Fe-Ni
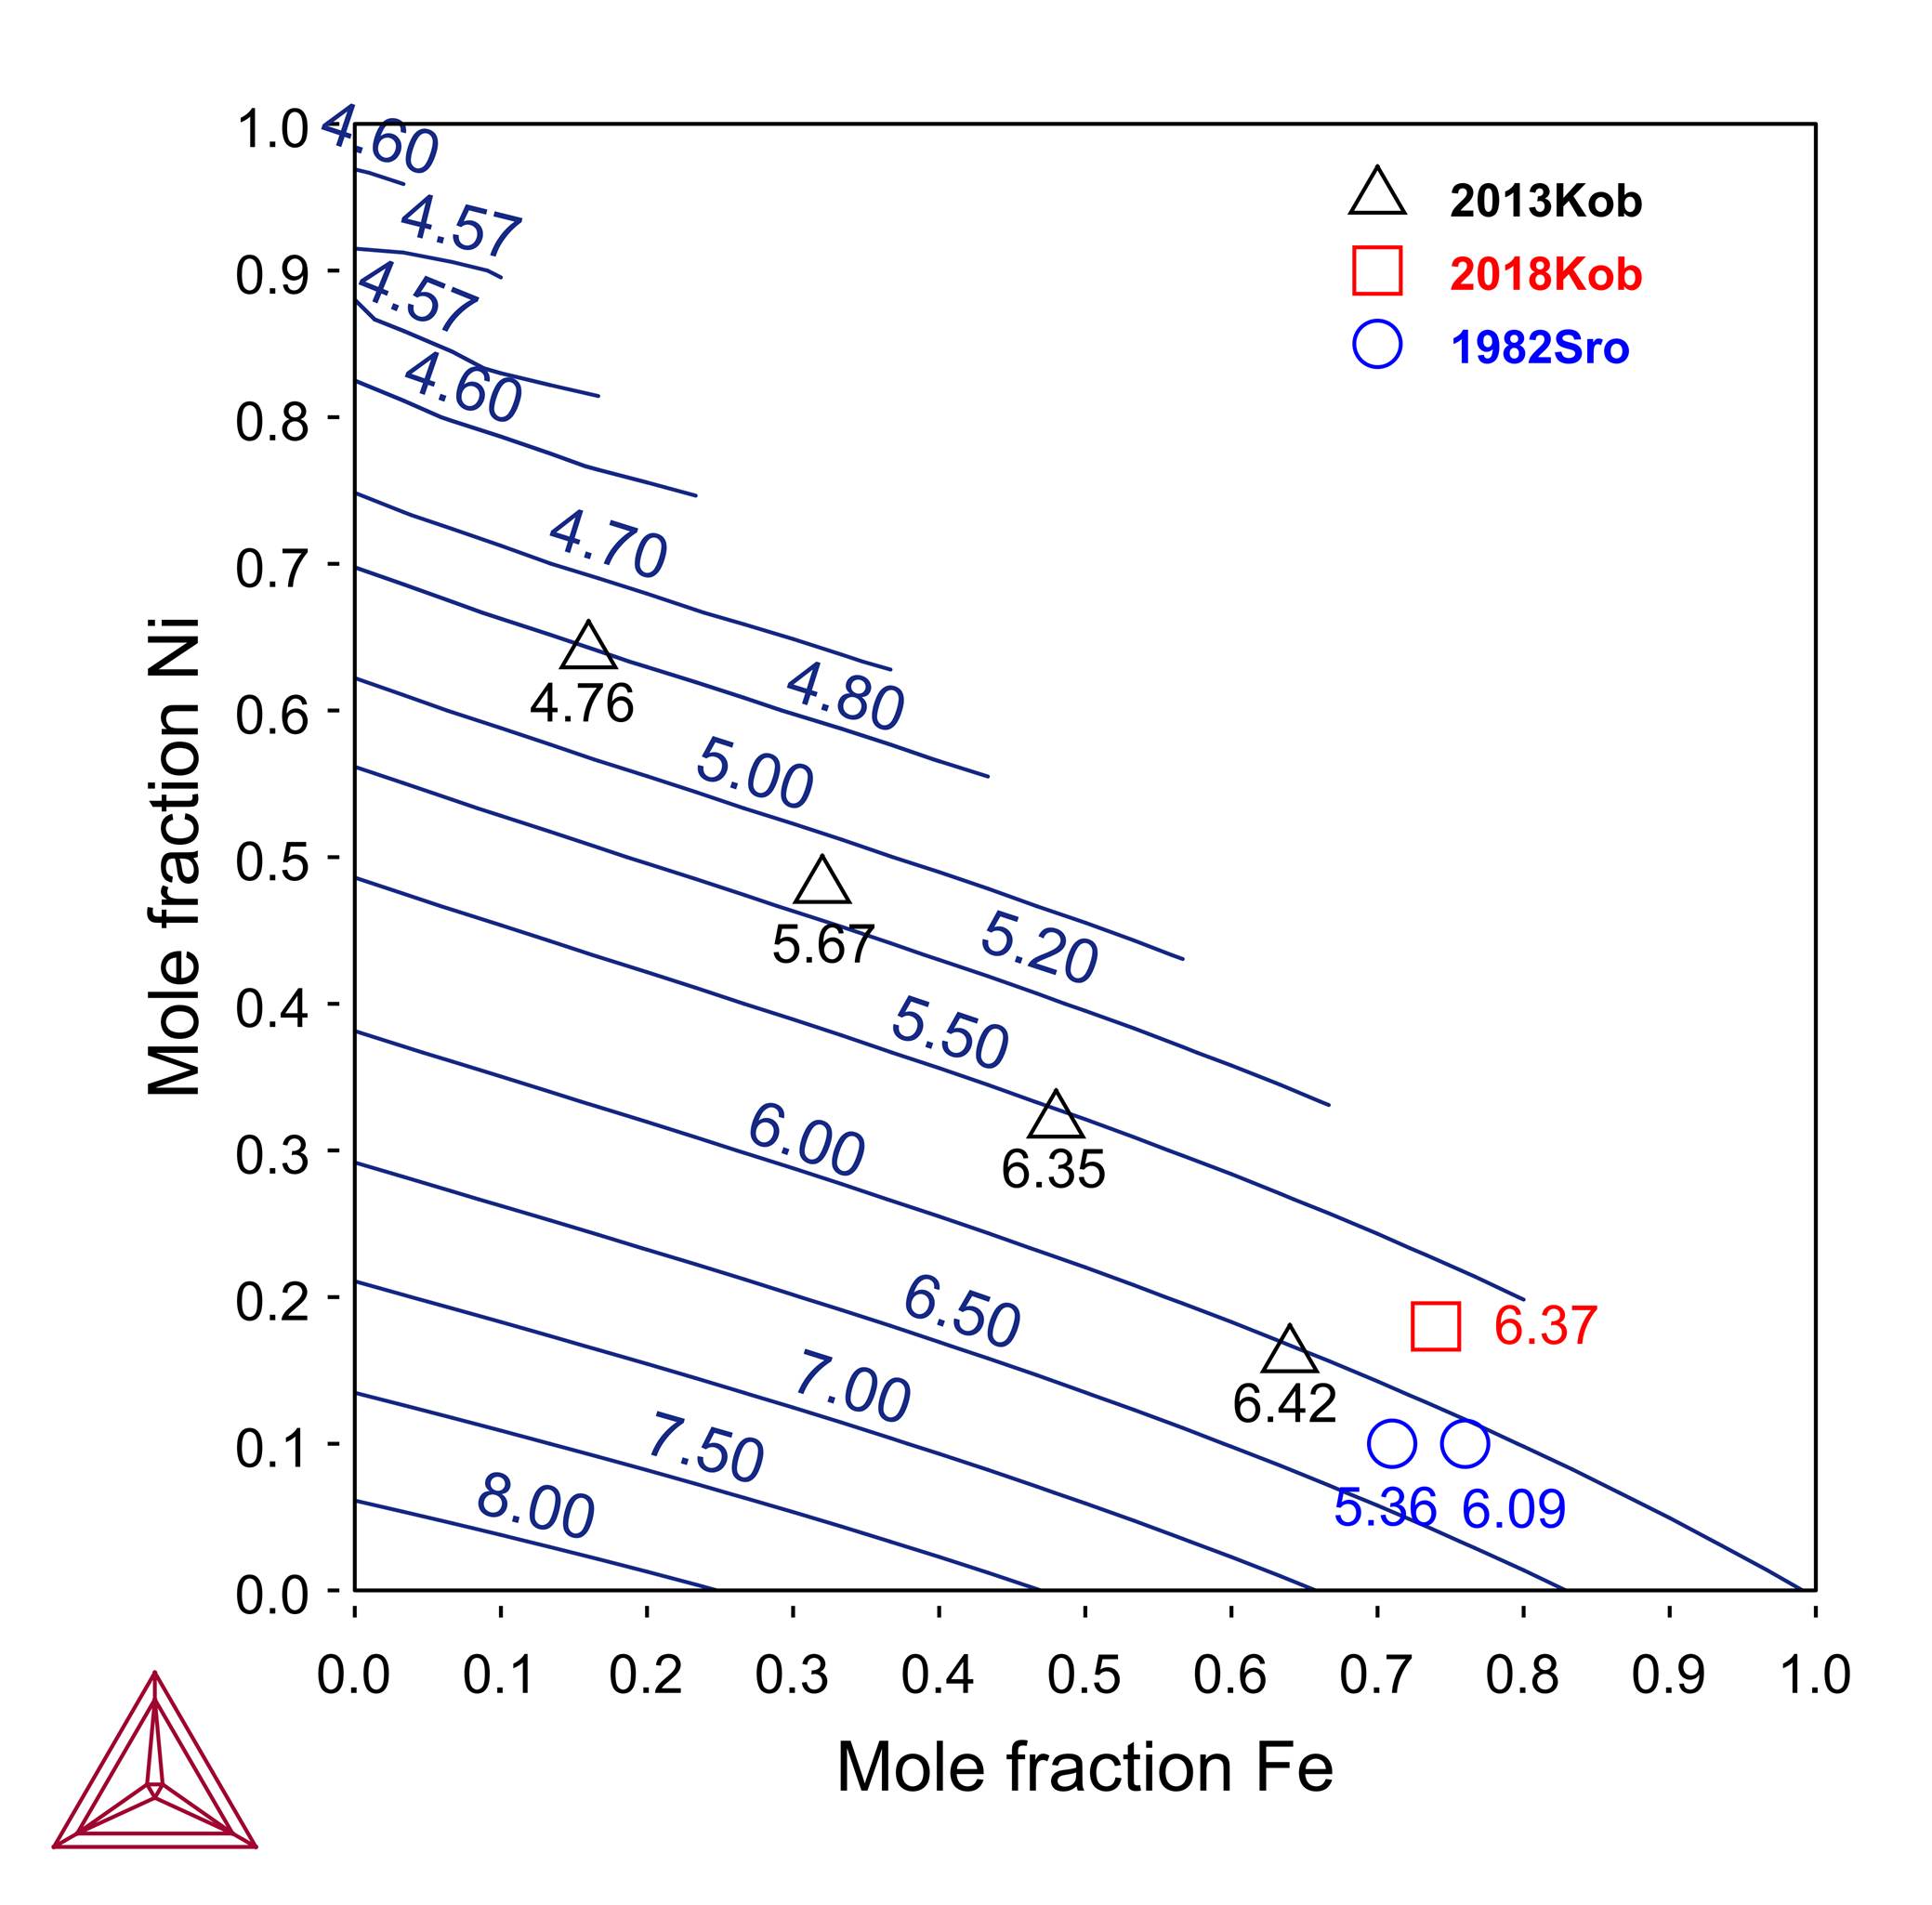
The isoviscosity curves of the Cr-Fe-Ni ternary system at 1800 K is shown.
Figure 3: Isoviscosity of Cr-Fe-Ni at 1800 K. The viscosity values are in milli-Pascal. Second. Experimental data is from [2013Kob; 2018Kob].
References
[2011Sat] Y. Sato, Representation of the Viscosity of Molten Alloy as a Function of the Composition and Temperature. Jpn. J. Appl. Phys. 50, 11RD01 (2011).
[2013Kob] H. Kobatake, J. Brillo, Density and viscosity of ternary Cr–Fe–Ni liquid alloys. J. Mater. Sci. 48, 6818–6824 (2013).
[2018Kob] H. Kobatake, J. Brillo, Surface tension and viscosity measurement of ternary Cr-Fe-Ni liquid alloys measured under microgravity during parabolic flights. High Temp. -- High Press. 47, 465–477 (2018).


