Isothermal and Vertical Sections
Typical ternary phase diagrams are isothermal and vertical sections. Such diagrams using the TCS Noble Metal Alloys Database (TCNOBL) can be of practical applications as well, e.g. making a preliminary determination of the heating temperature for melting, solution treatment, homogenization, and aging for specific alloys.
The Au-Cu-Si based bulk metallic glasses are attractive candidates in jewelry applications due to their high hardness, low melting temperature, minimal solidification shrinkage, and good processing ability. Among them, the best glass former was found in the Au-Cu-Si-Ag-Pd system that possesses high Au content as well as premium white gold color. For a better understanding of the phase formation and to facilitate the design of Au-based bulk metallic glasses, knowledge on thermodynamics of constituent binary and ternary systems is essential.
When working in Thermo‑Calc with ternary diagrams you use either the Ternary Calculator (in Graphical Mode) or the Ternary module (in Console Mode). The fundamental calculation engine is the same but you access the settings in different ways.
Au-Cu-Si
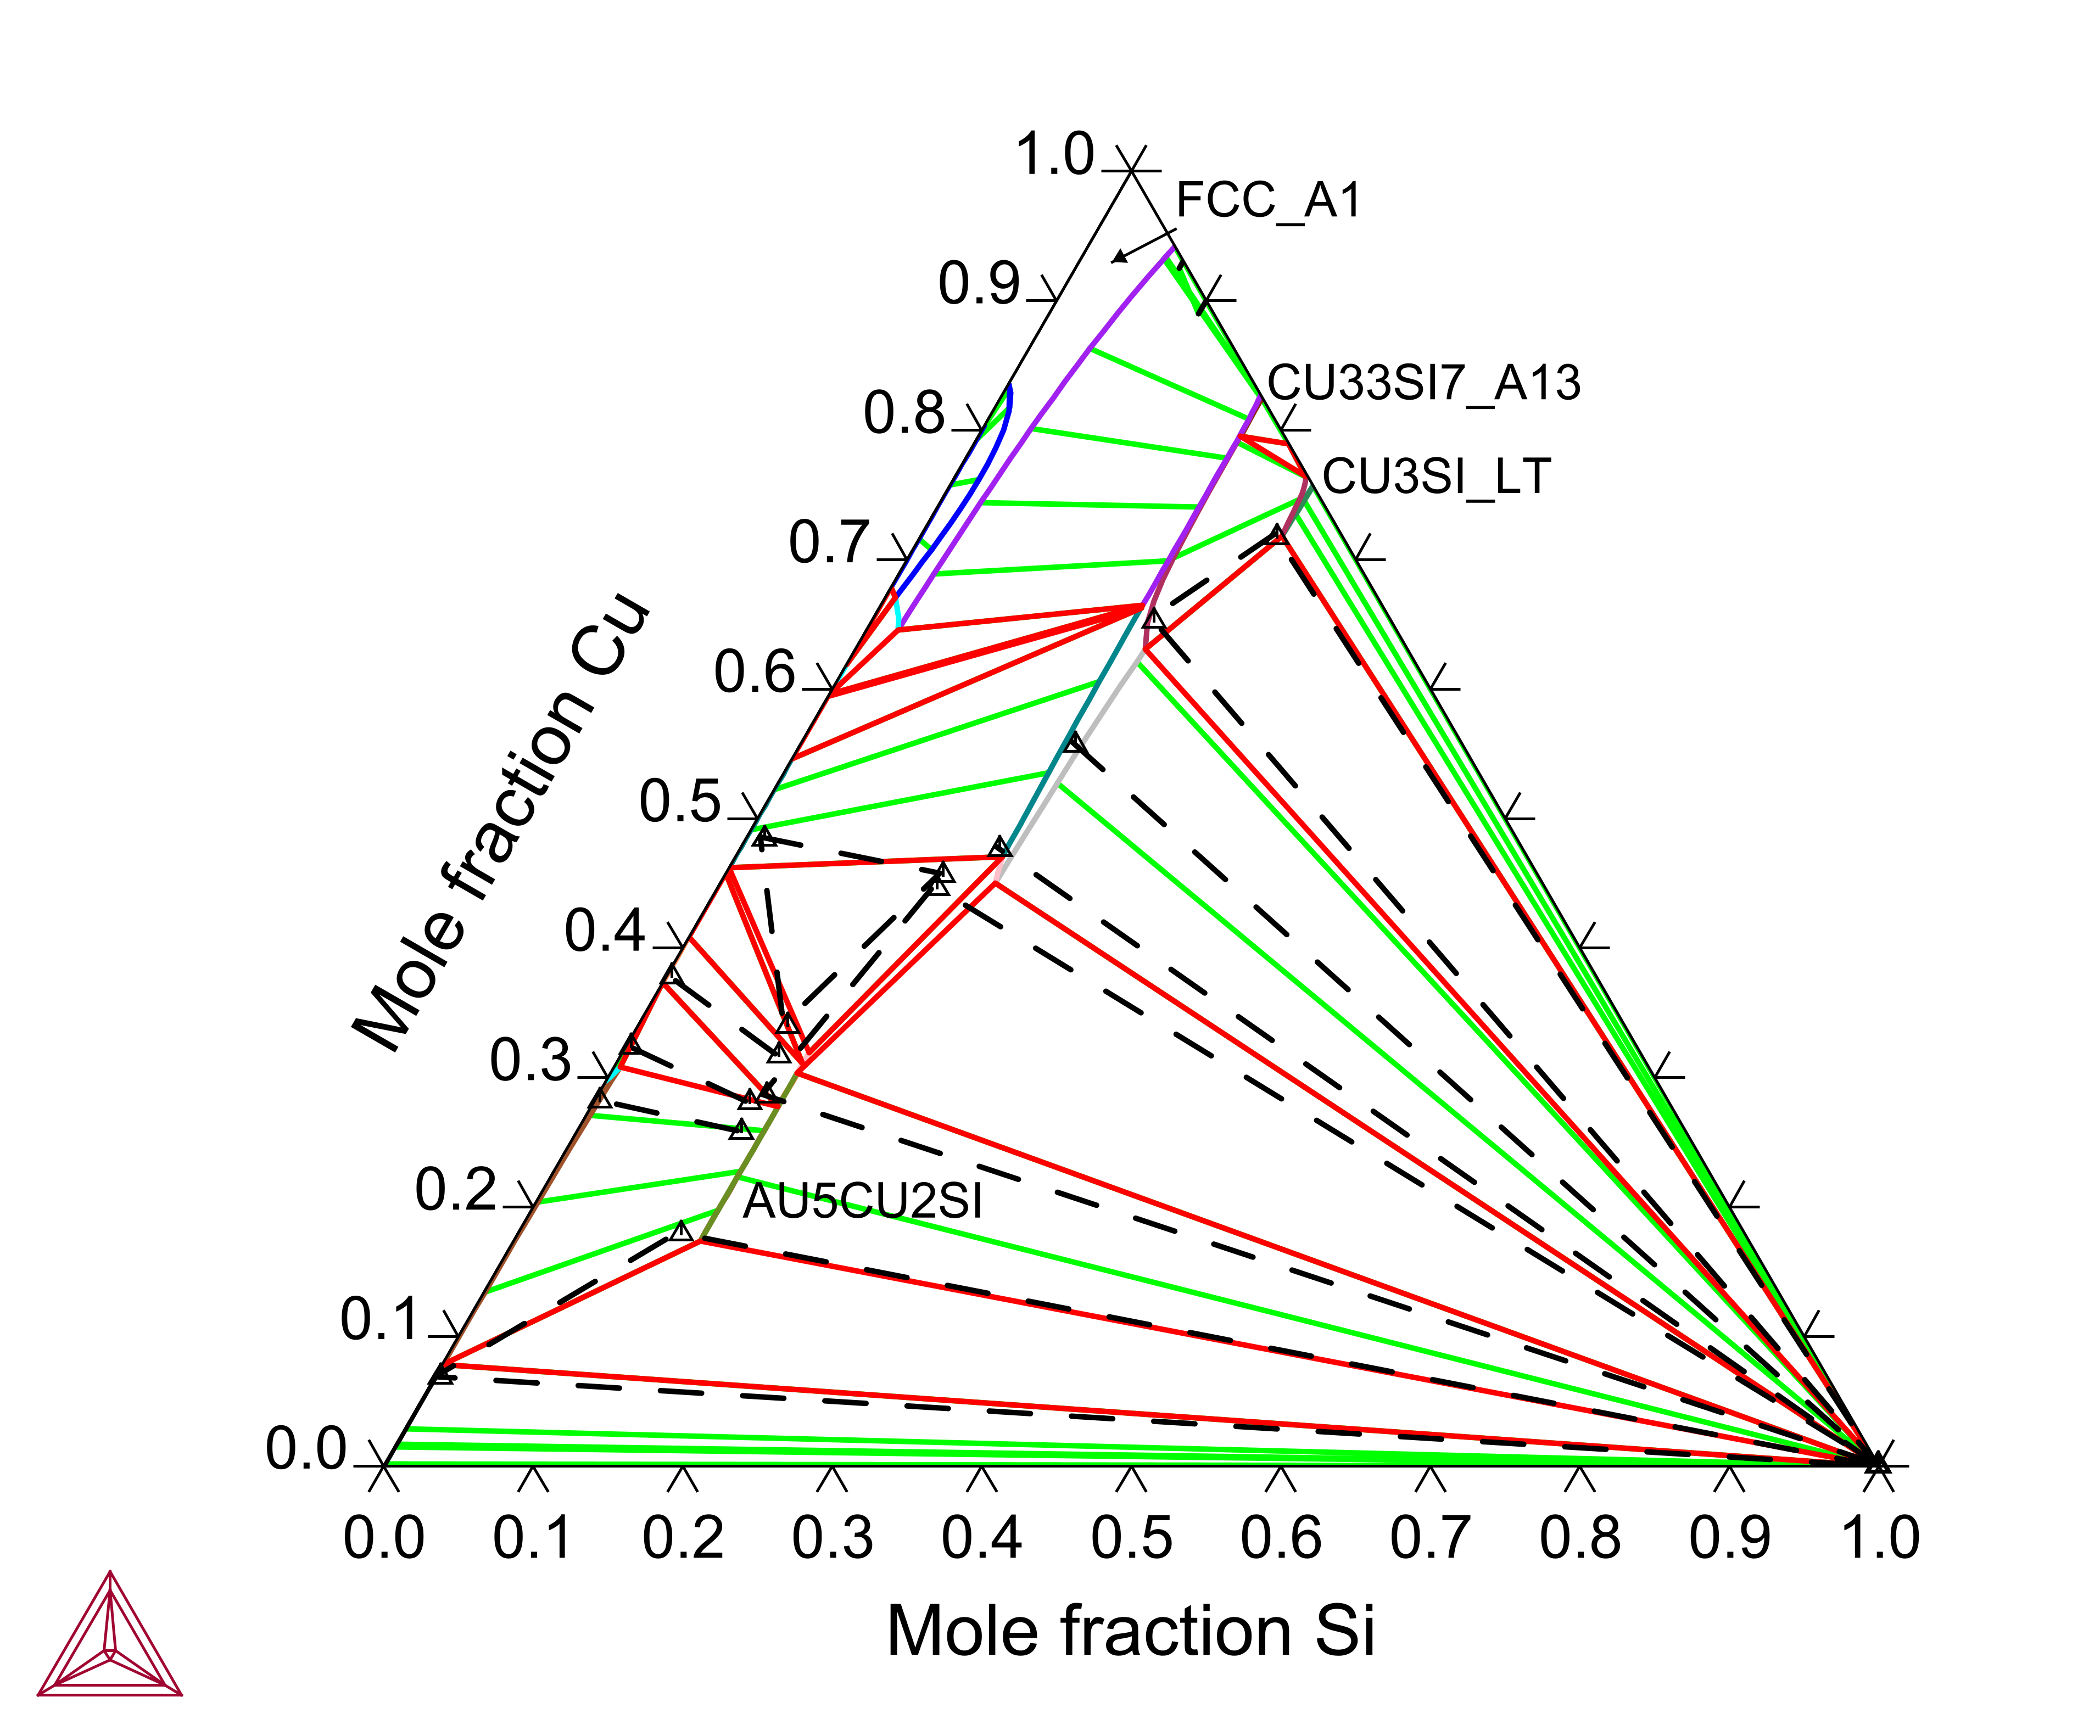
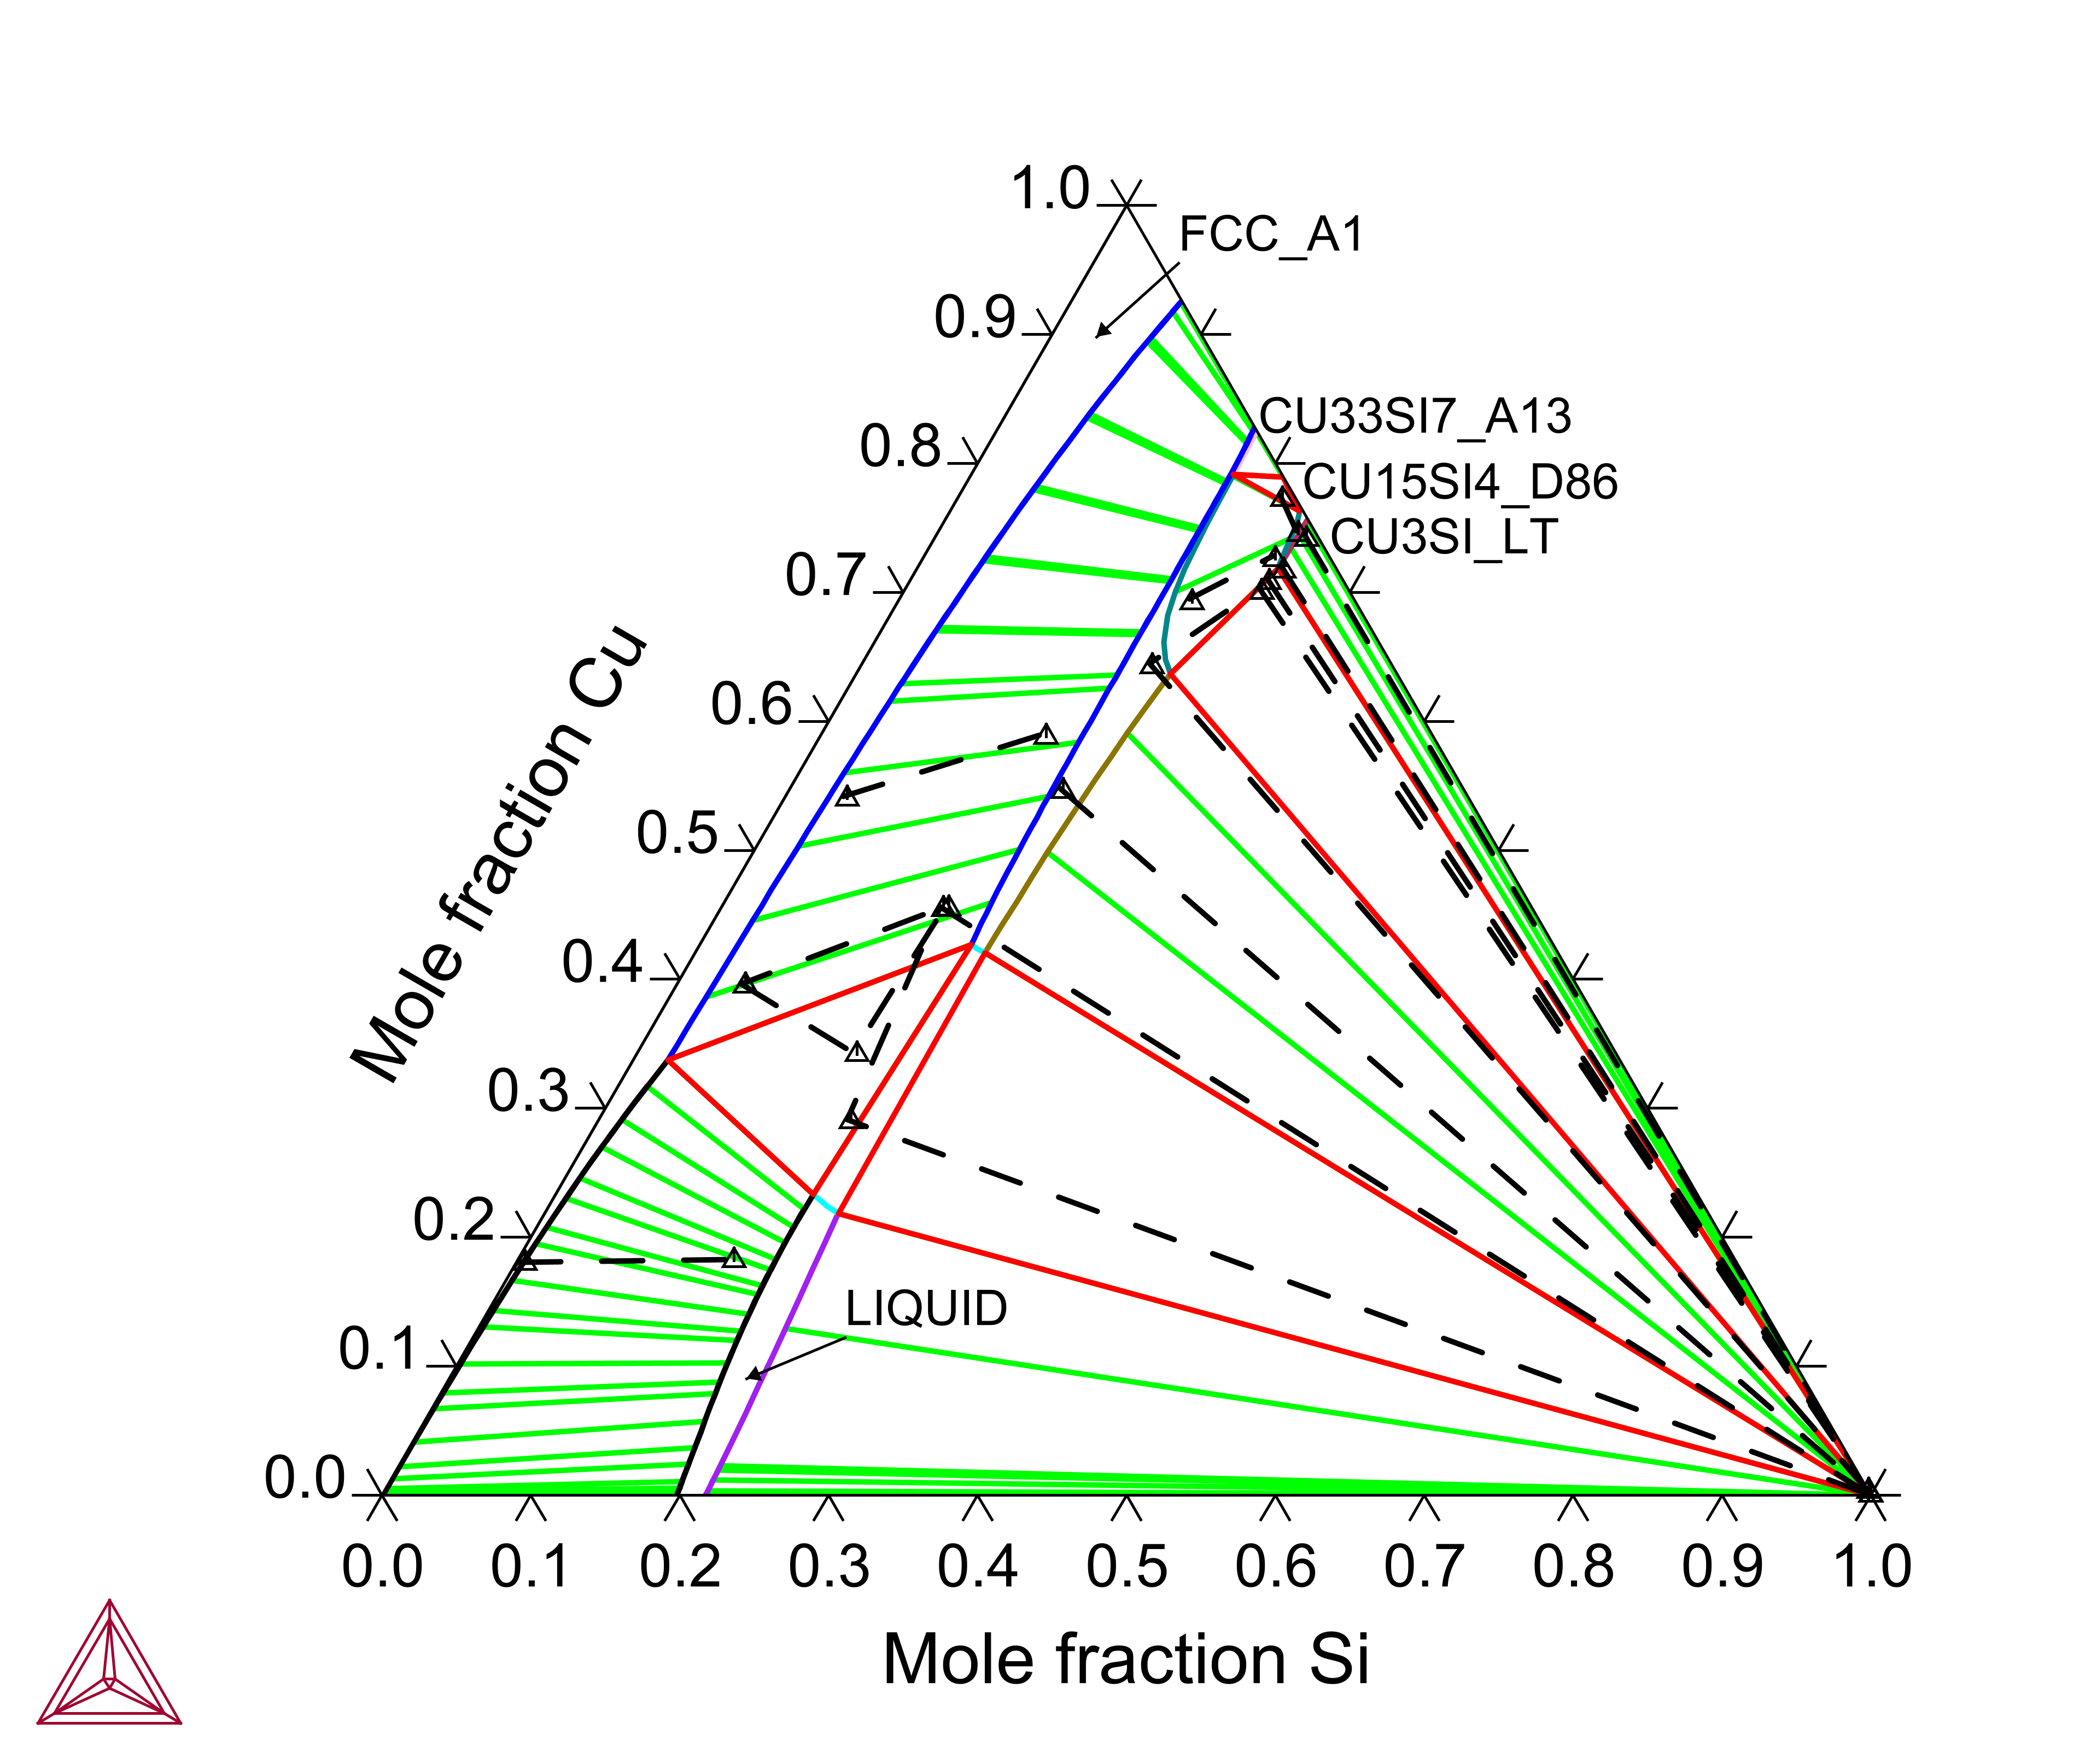
Figure 1: Calculated Au-Cu-Si isothermal sections at (top) 250 °C, and (bottom) 400 °C compared with experimentally measured tie-lines and tie-triangles by [2014Bla].
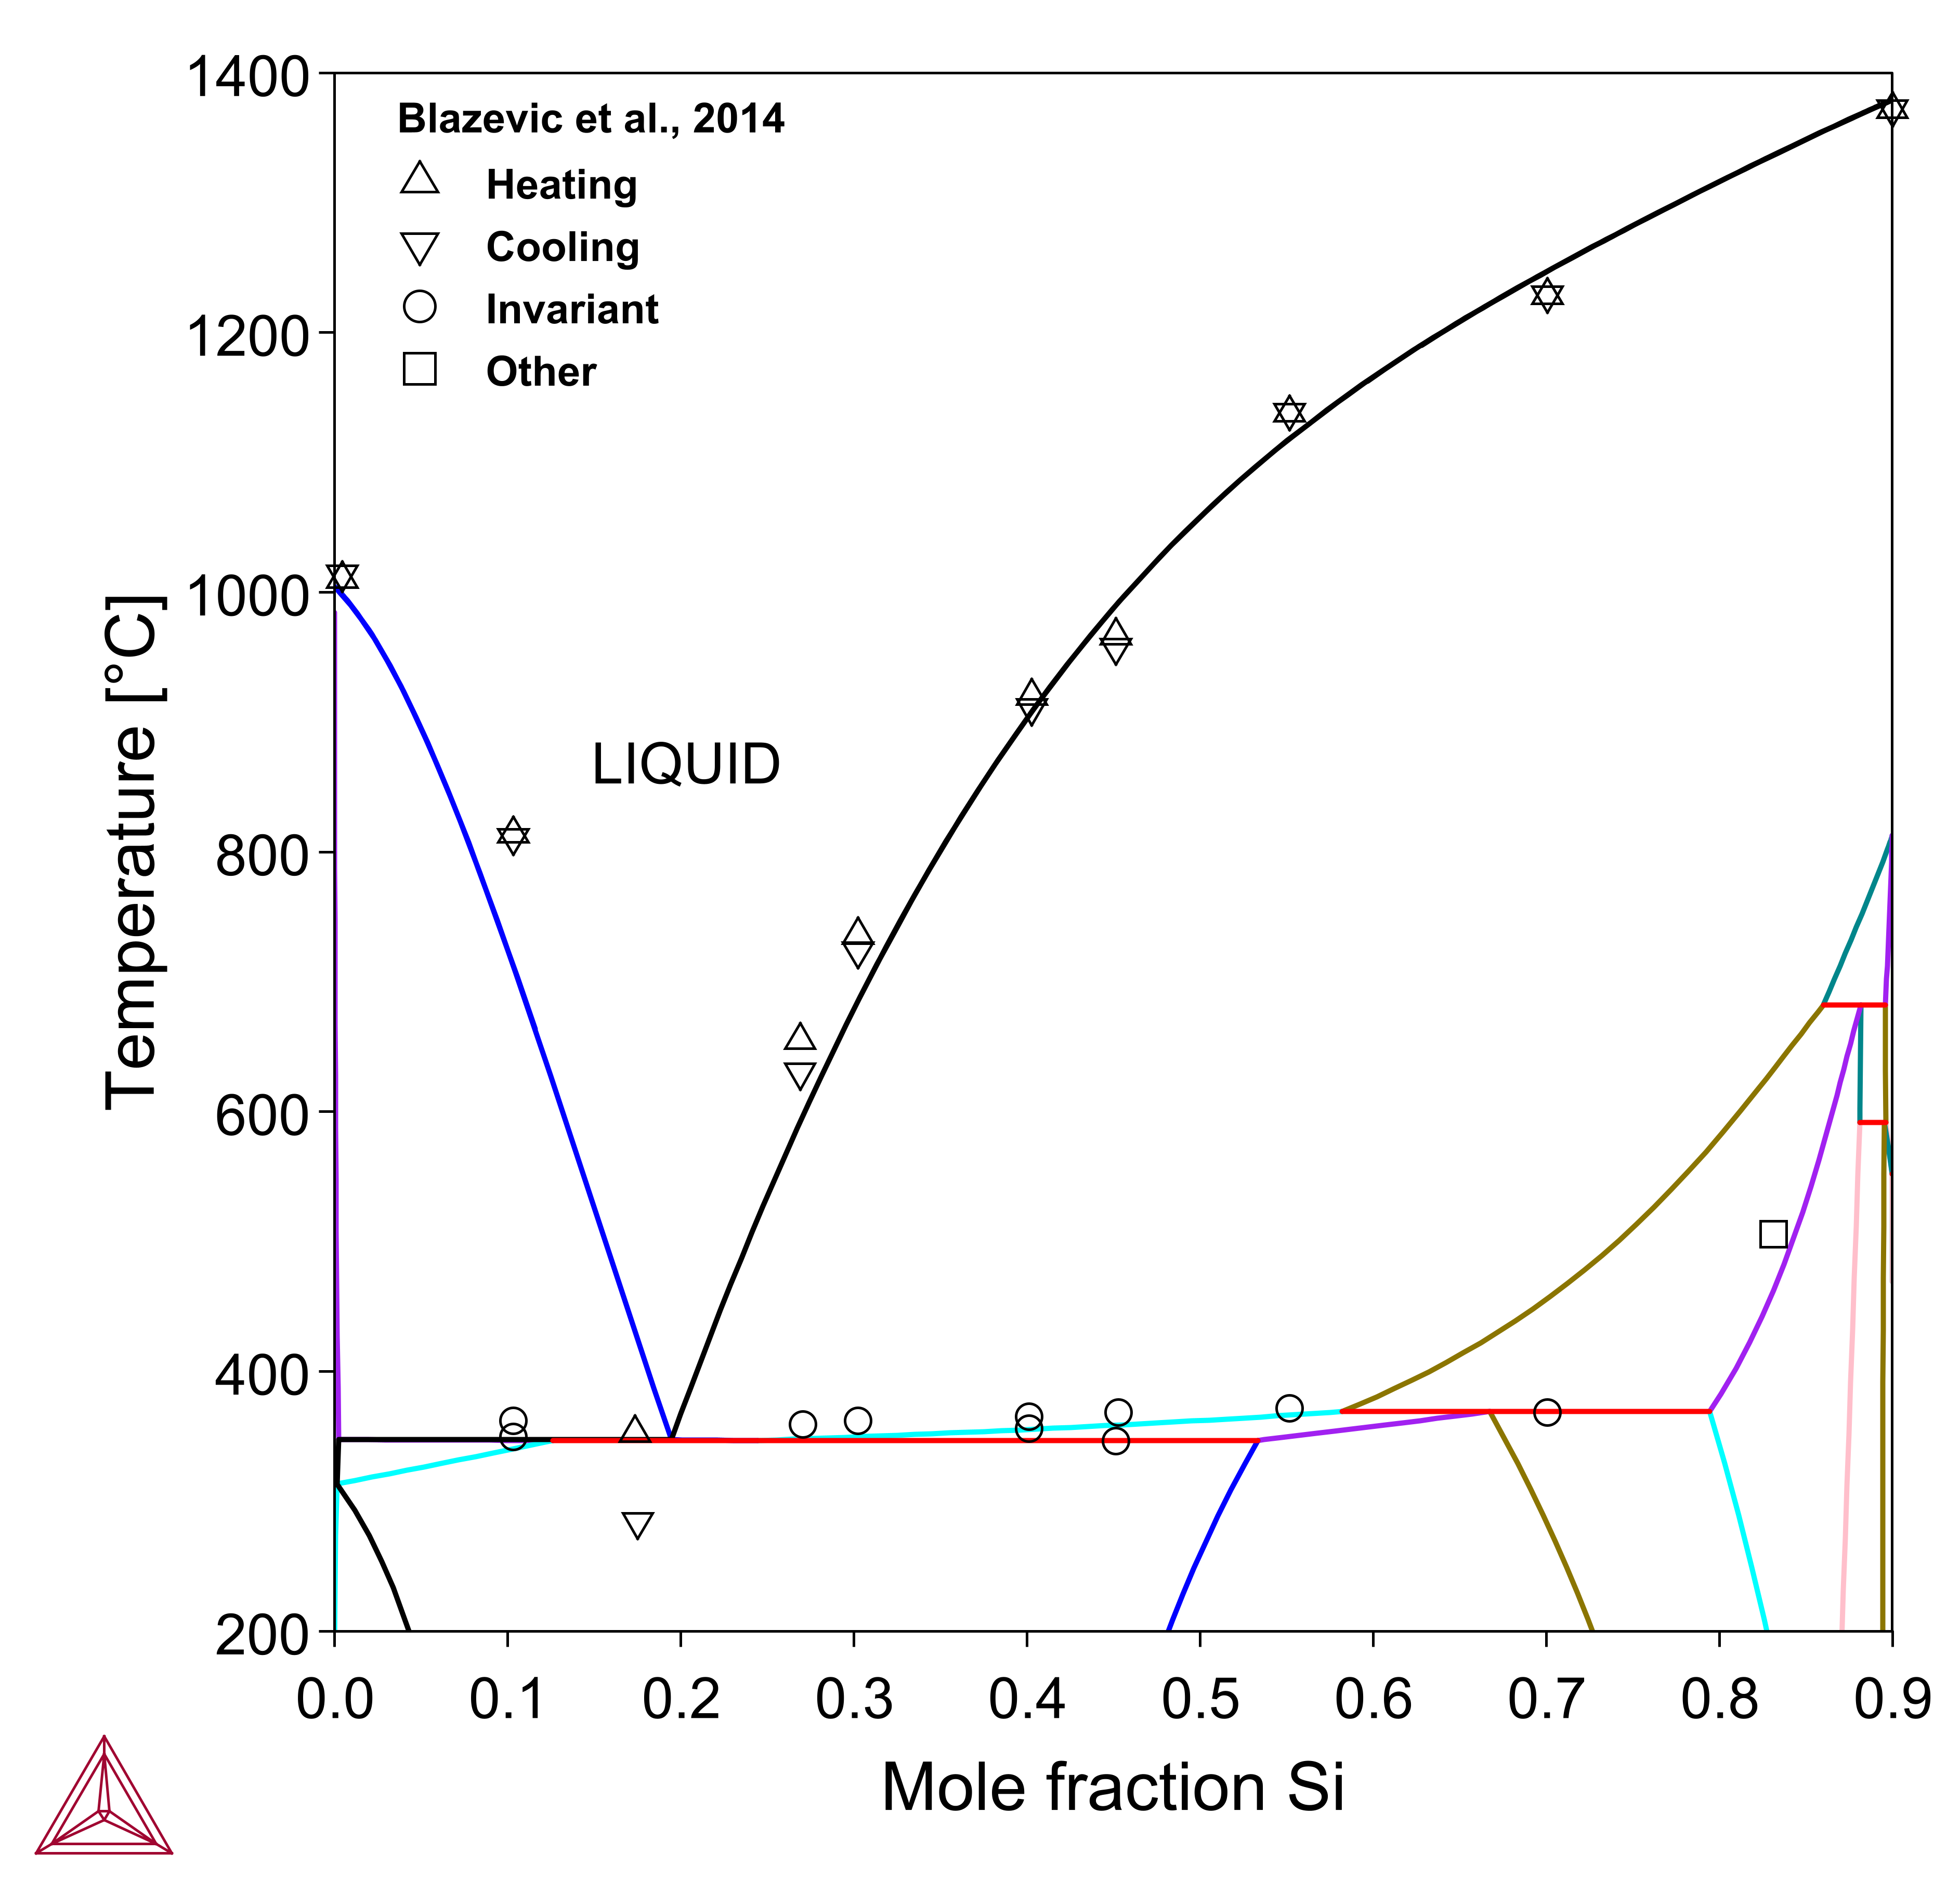
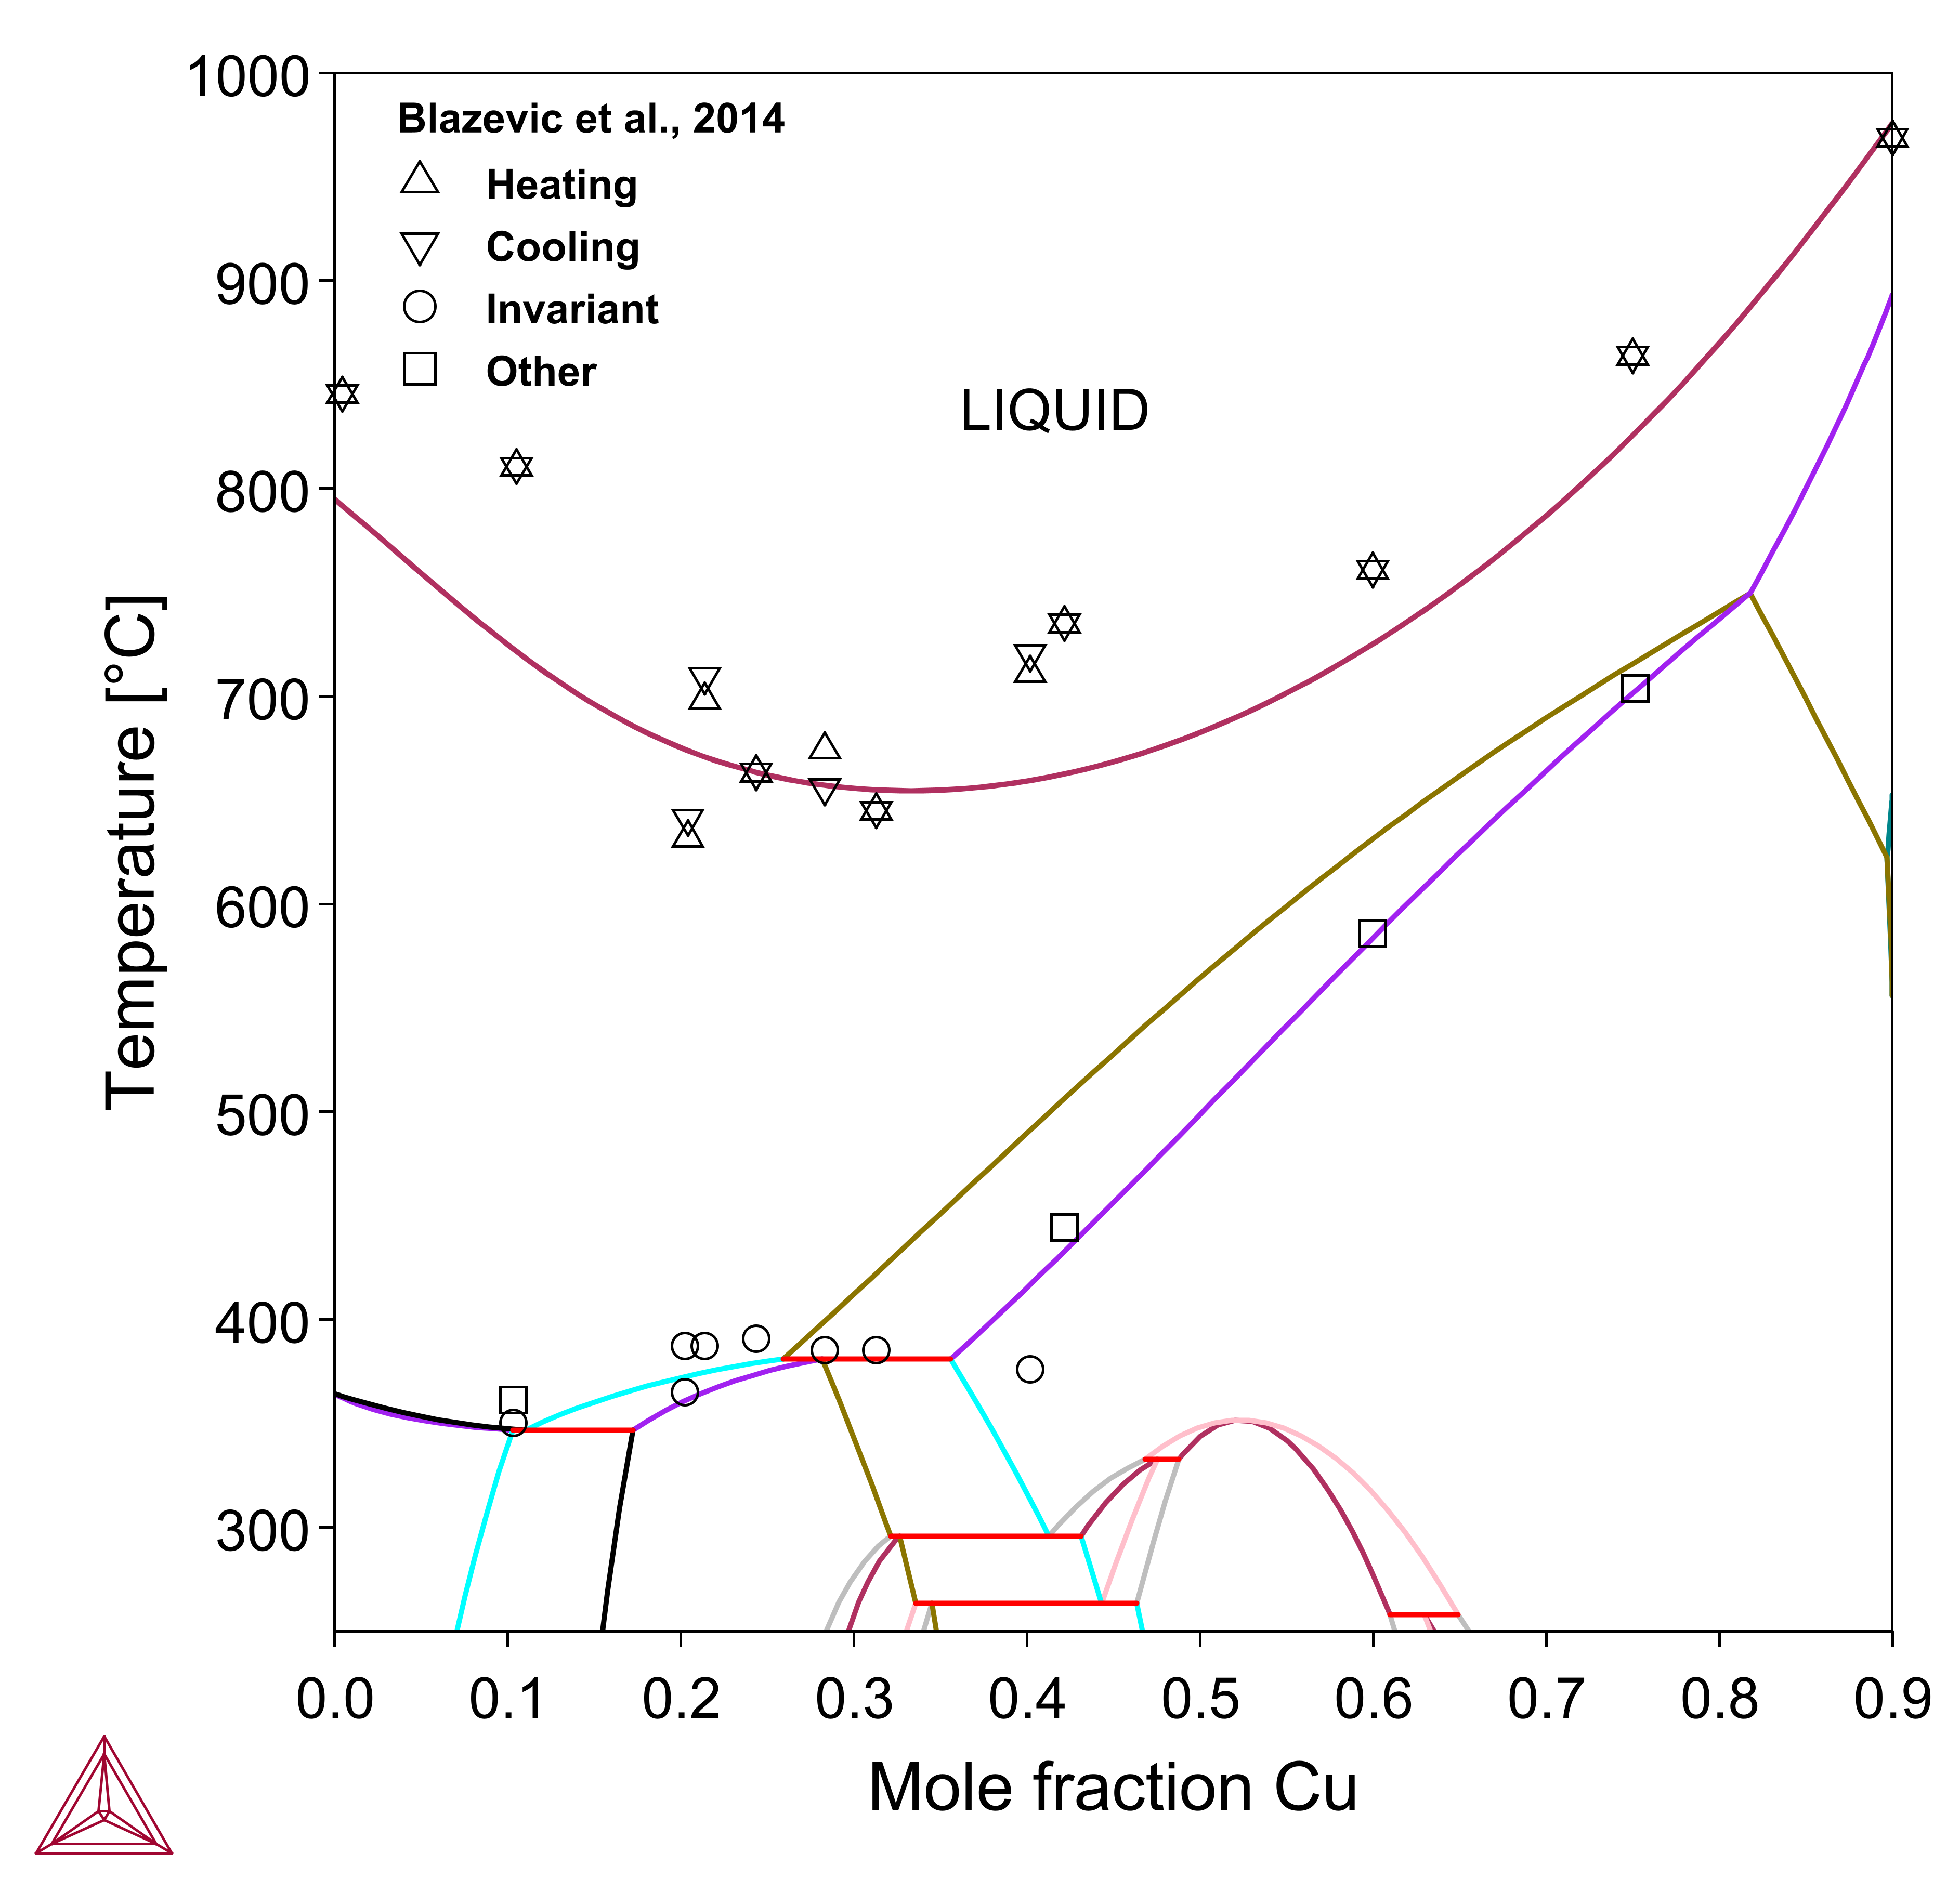
Figure 2: Calculated Au-Cu-Si vertical sections at (top) 10 at.% Cu, and (bottom) 10 at.% Si compared with experimental data [2014Bla].
Ag-Cu-Si
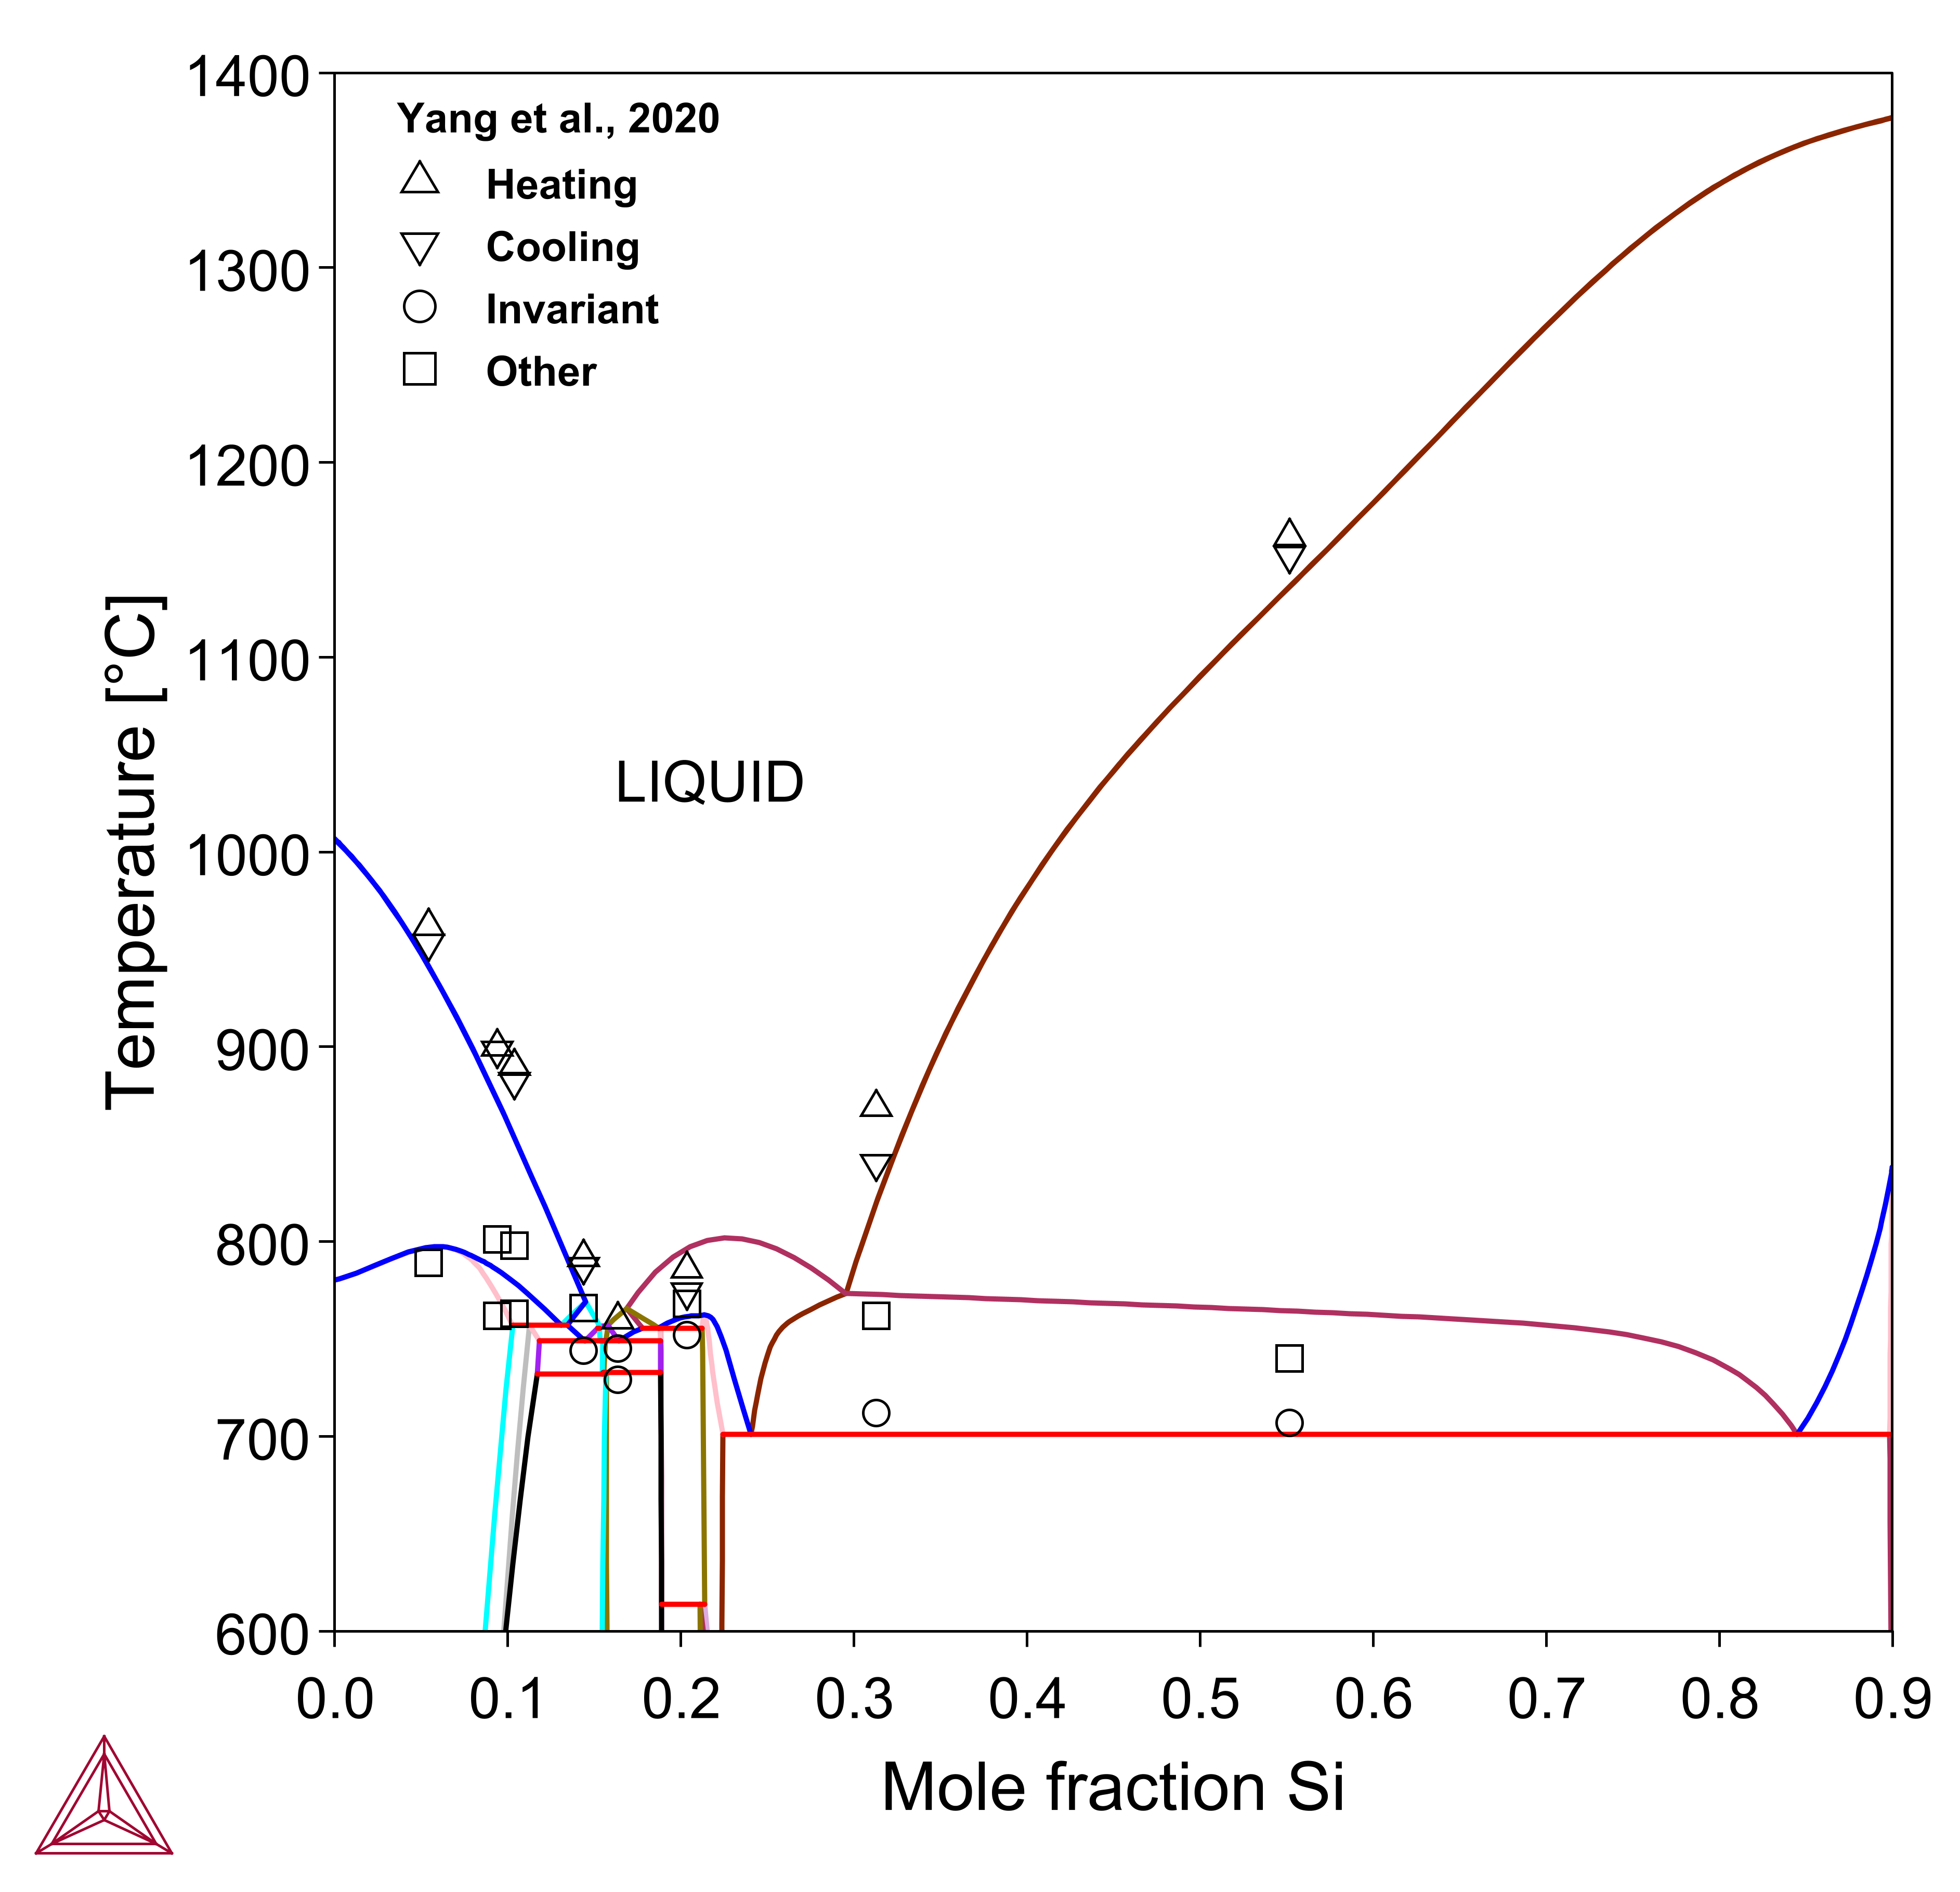
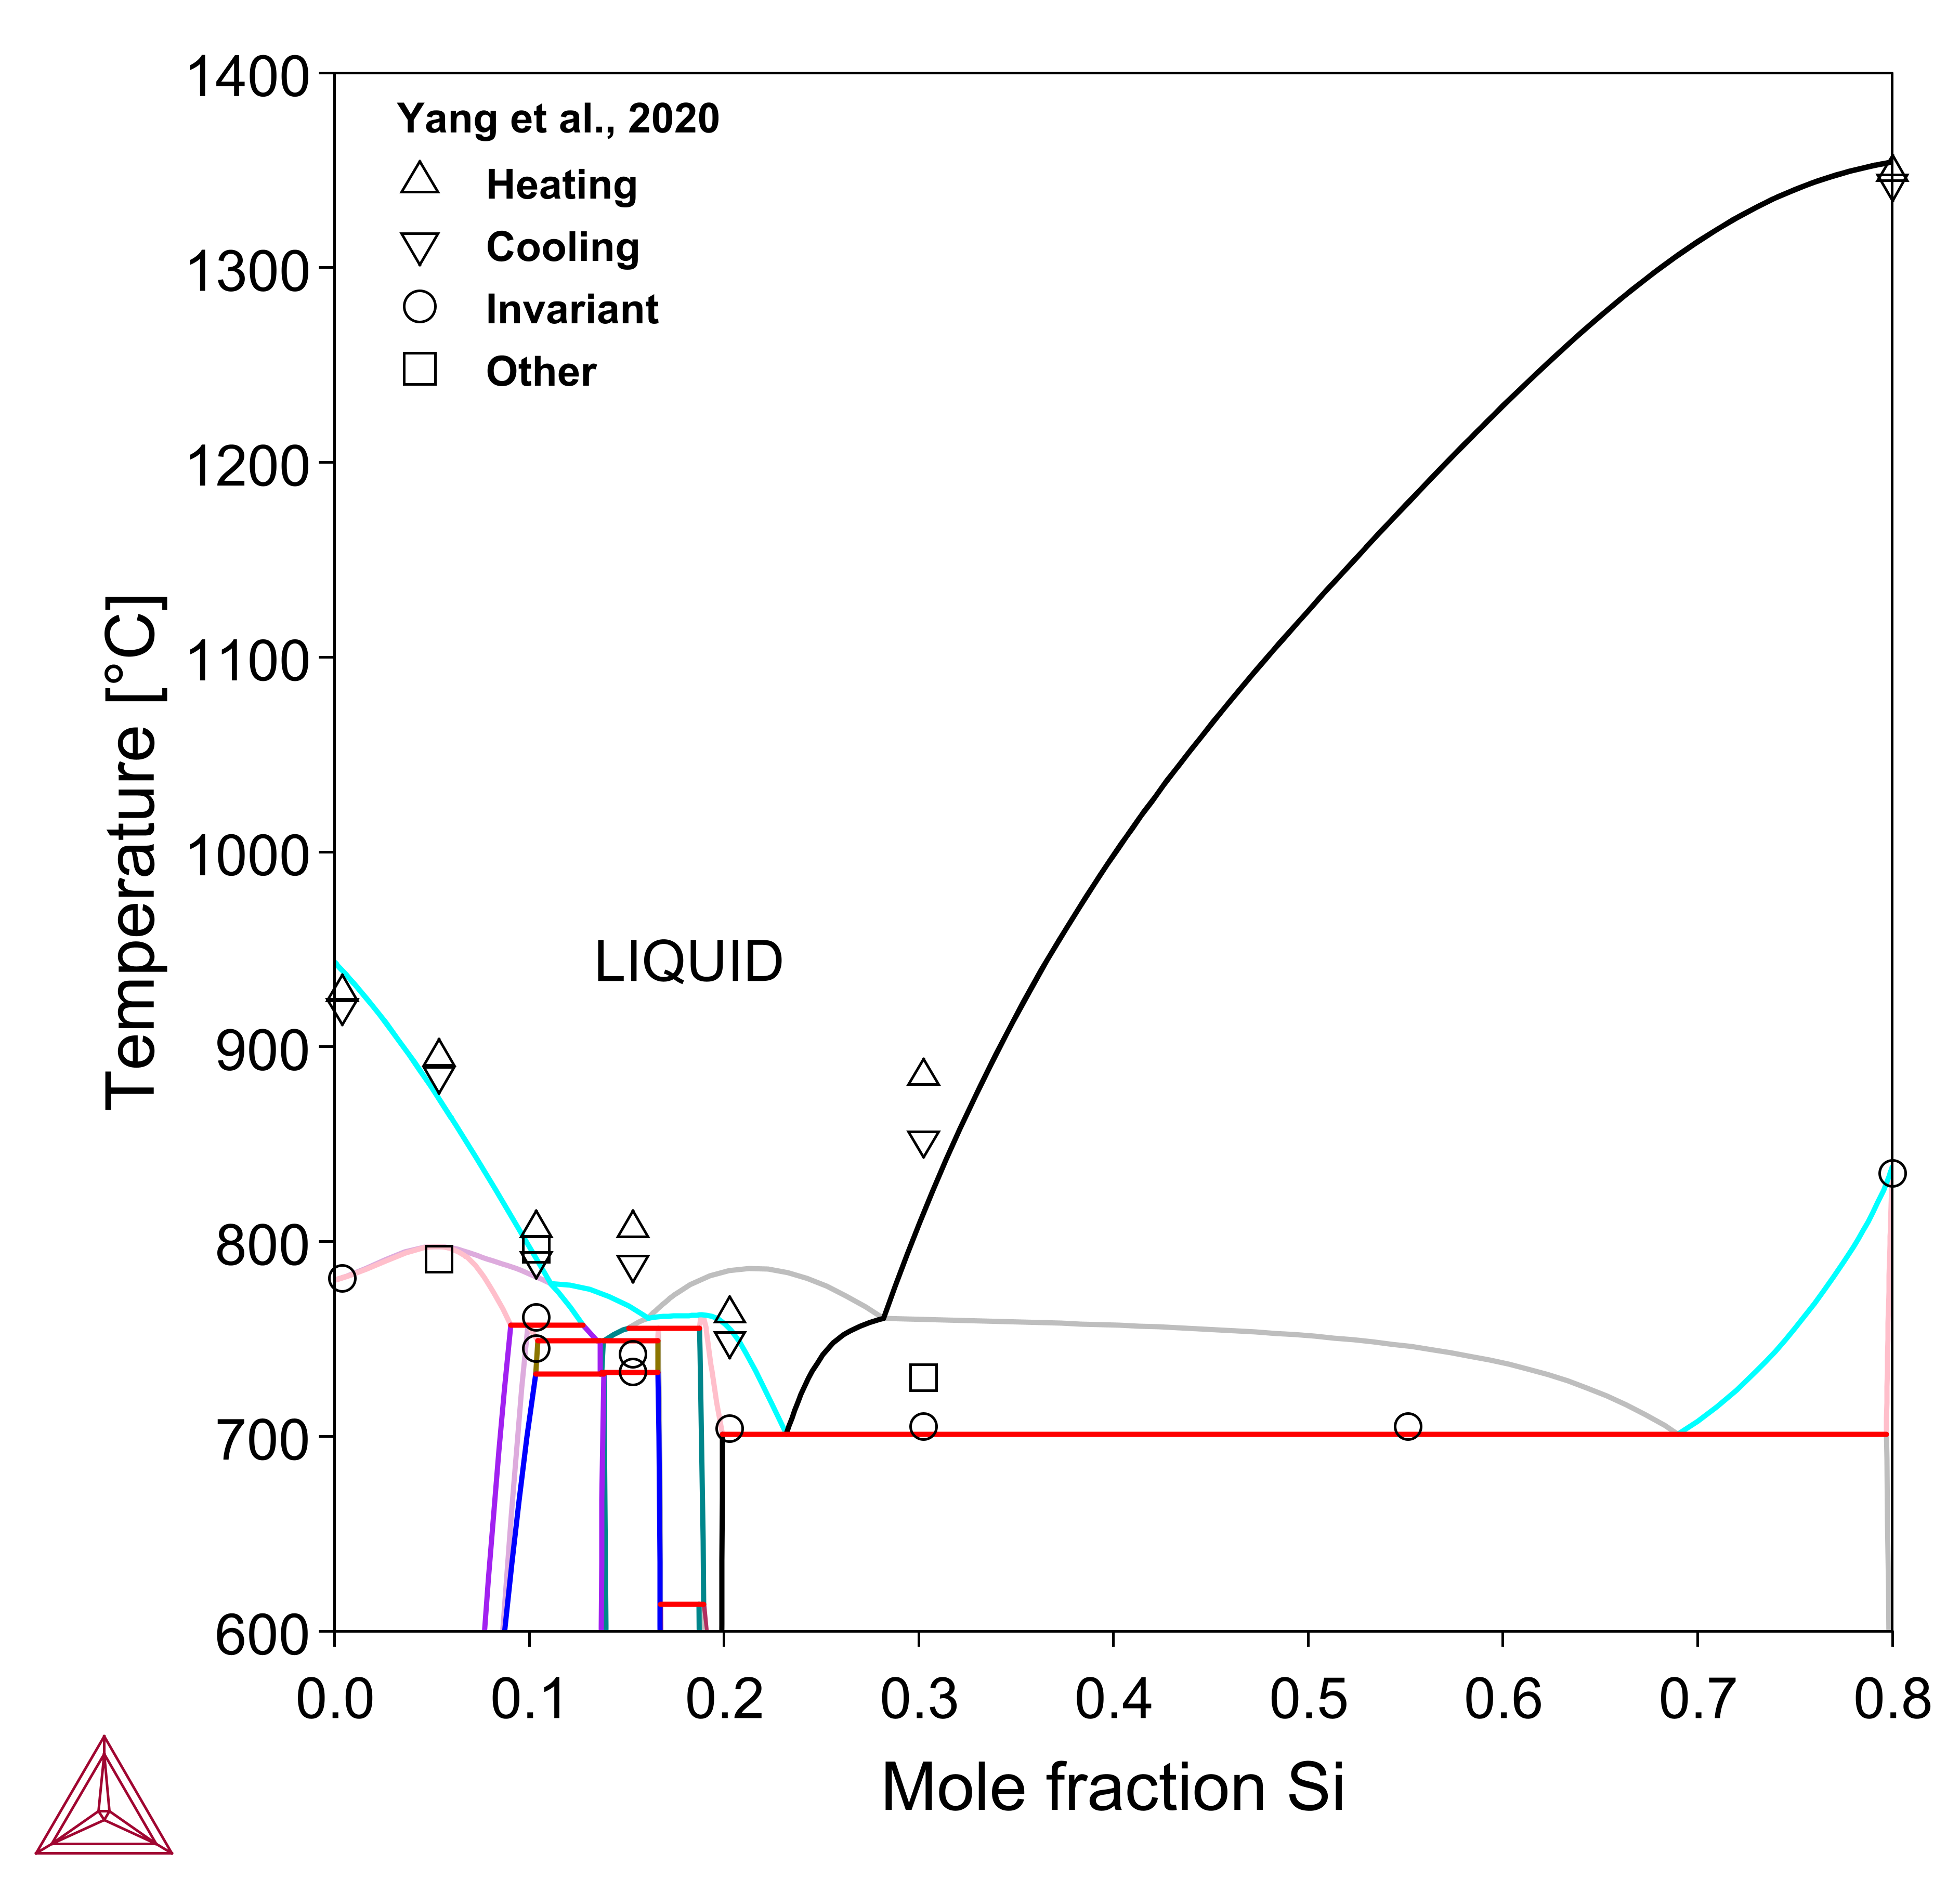
Figure 3: Calculated Ag-Cu-Si vertical sections at (top) 10 at.% Ag, and (bottom) 20 at.% Ag compared with experimental data [2020Yan].
References
[2014Bla] A. Blazevic, H. S. Effenberger, K. W. Richter, Phase equilibria in the system Au–Cu–Si and structural characterization of the new compound Au5±xCu2±xSi. Intermetallics 46, 190–198 (2014).
[2020Yan] H. Yang, G. Reisinger, H. Flandorfer, K. W. Richter, Phase Equilibria in the System Ag-Cu-Si. J. Phase Equilibria Diffus. 41, 79–92 (2020).
