Plot Renderer Settings (Multiphase)
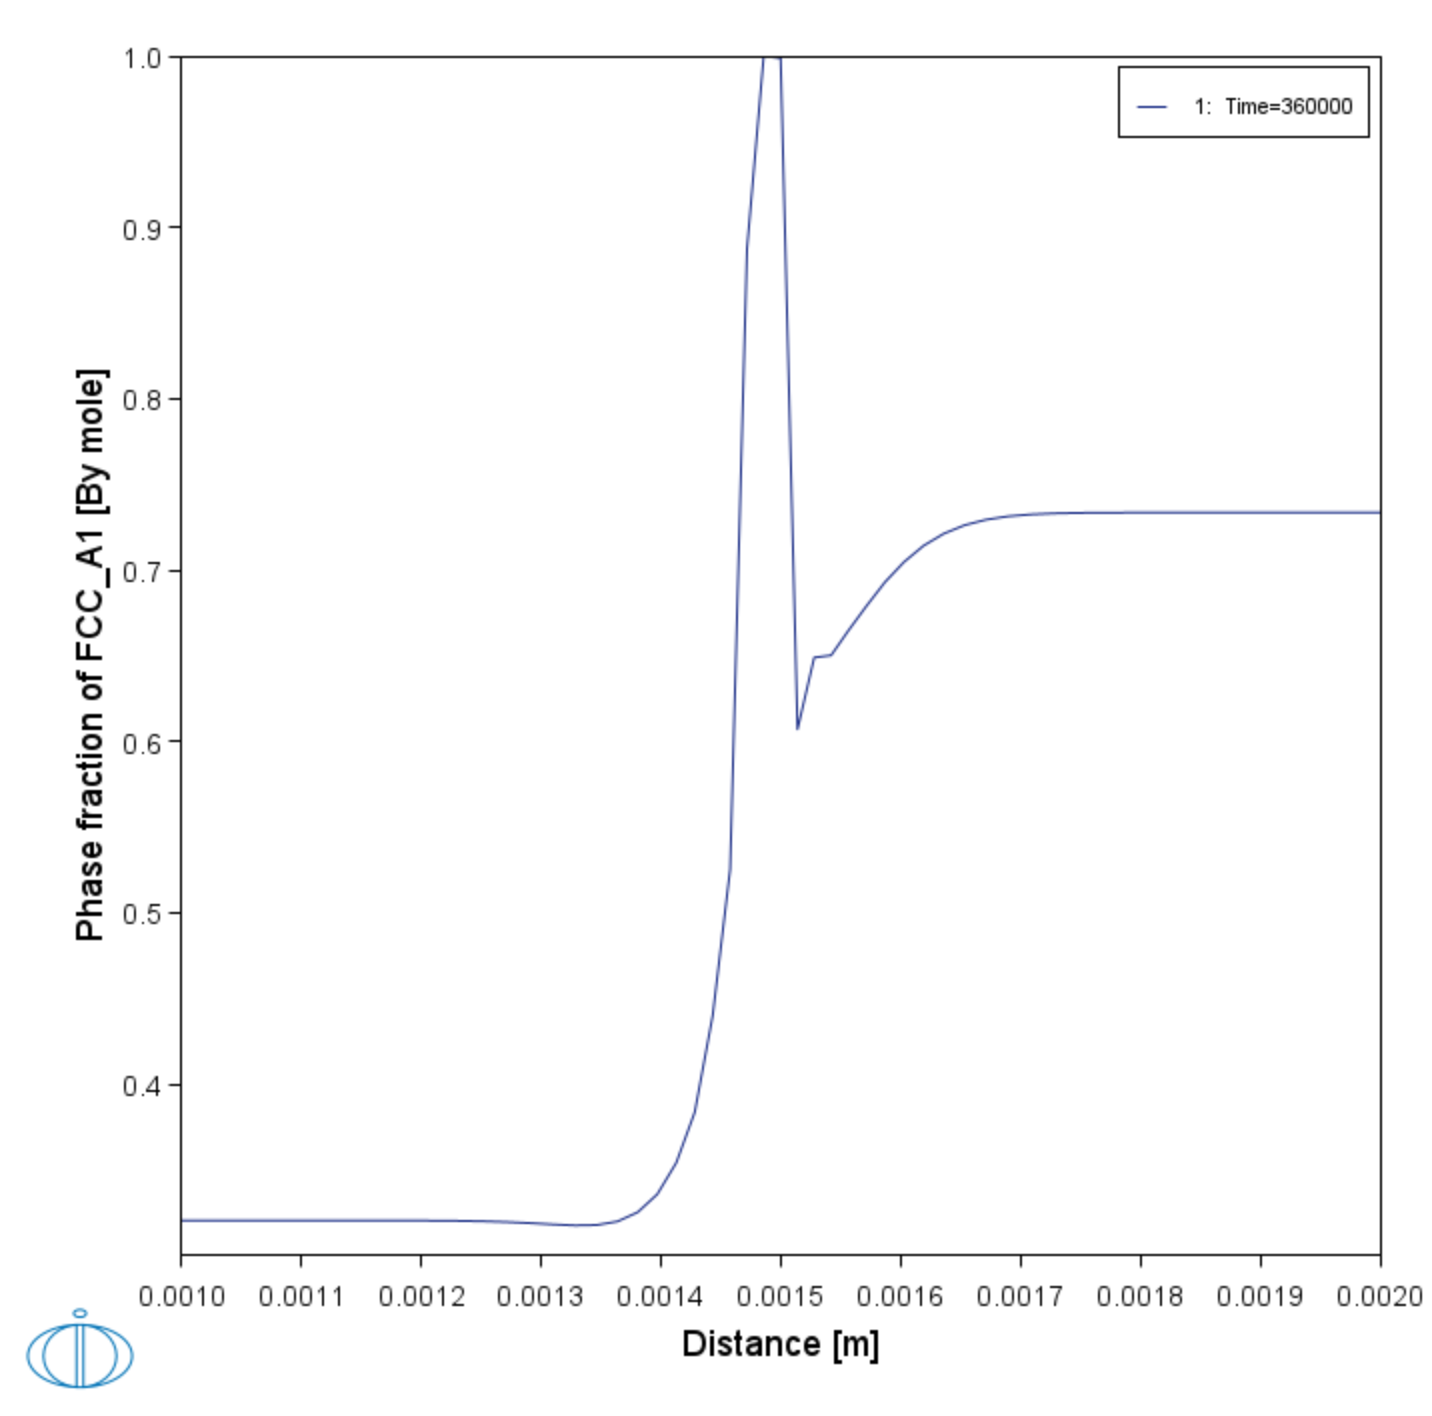
After you enter the settings for the System Definer and Diffusion Calculator, you define the plot parameters. For this example you want to plot the mole fraction fcc phase as a function of distance at the end of the heat treatment.
The plot of phase fraction vs distance shows that a single phase fcc zone has formed and this was also observed experimentally, see [1995Eng].
- Click the Plot Renderer node.
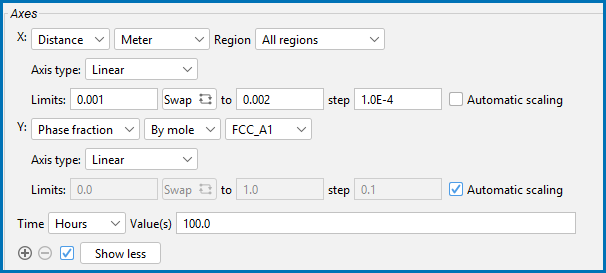
- Click Show more. Then under Axes for X, click to clear the Automatic scaling checkbox.
- Enter the Limits:
0.001to0.002step1.0E-4. - For Y, choose Phase fraction and FCC_A1.
- Click Perform If you have entered the same settings you will get this plot result.
- Right-click Plot Renderer and rename it to
Phase fraction of FCC.
Reference
[1995Eng] A. Engström, Interdiffusion in multiphase, Fe-Cr-Ni diffusion couples. Scand. J. Metall. 24, 12–20 (1995).

