Multiphase Example Project
For the multiphase simulation, you can open the example project file included with your installation to see how it is set up.
- Open Thermo‑Calc.
- There are different ways to access the examples.
- Click to open the Diffusion Module - DICTRA folder and locate the D_03_Diffusion_Multiphase.tcu file. Double-click to open it.
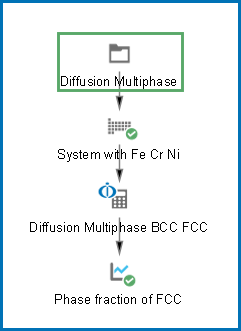
- The project opens in Thermo‑Calc. Click the top Project node (renamed to Diffusion Multiphase). At the bottom of the Configuration window click Perform Tree.
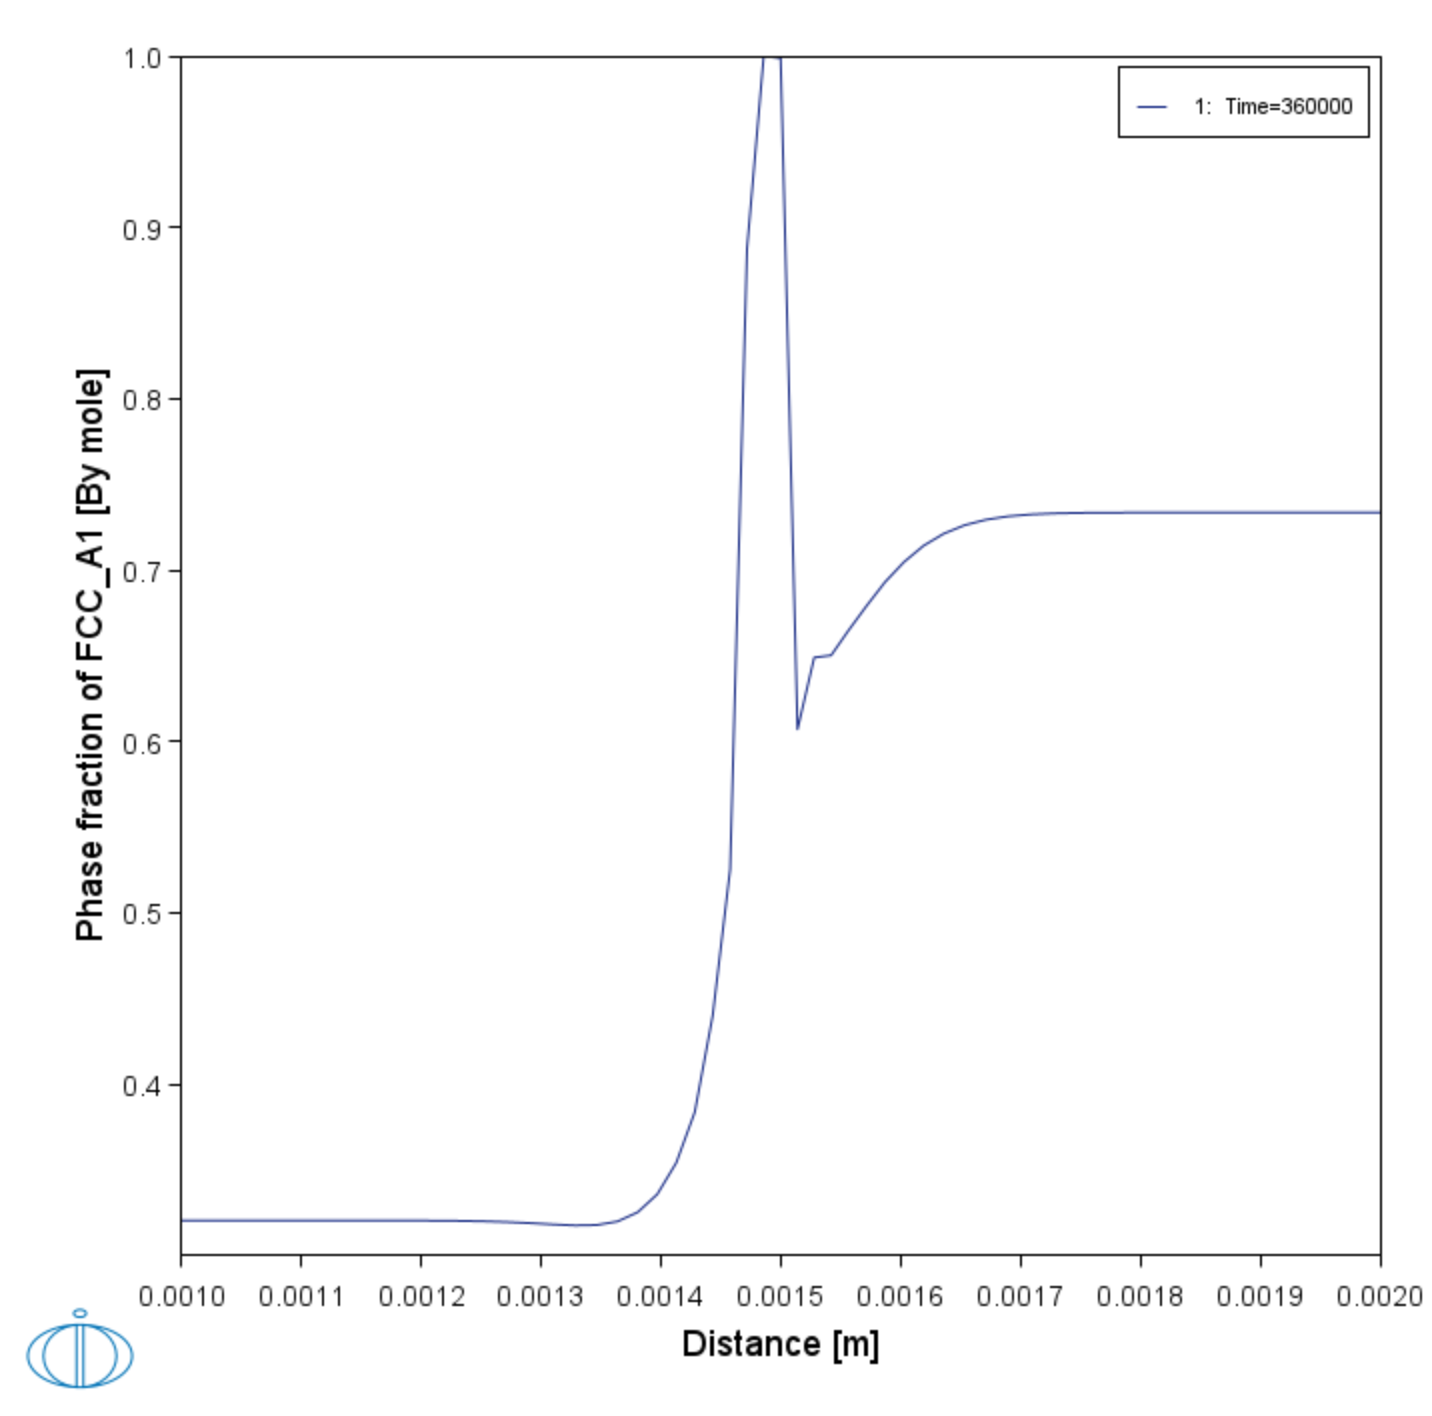
When completed, the results are plotted in the Visualizations window.
Visualizations
There is a variety of information shown in the Visualizations window that can be viewed during configuration and after performing the calculation.
- Composition Profiles and Thermal Profile: When setting up a calculator on a Configuration window you can preview the profile and adjust settings as needed. When you click a calculator node in the Project window, the matching name of the node is on the tab(s) displayed in the Visualizations window.
- Plot or Table results: After completing the set up and performing the calculation, to view the matching name of the node on tab(s) in the Visualizations window, either click a Plot Renderer or Table Renderer node in the Project window or click the tabs individually in the Visualizations window.
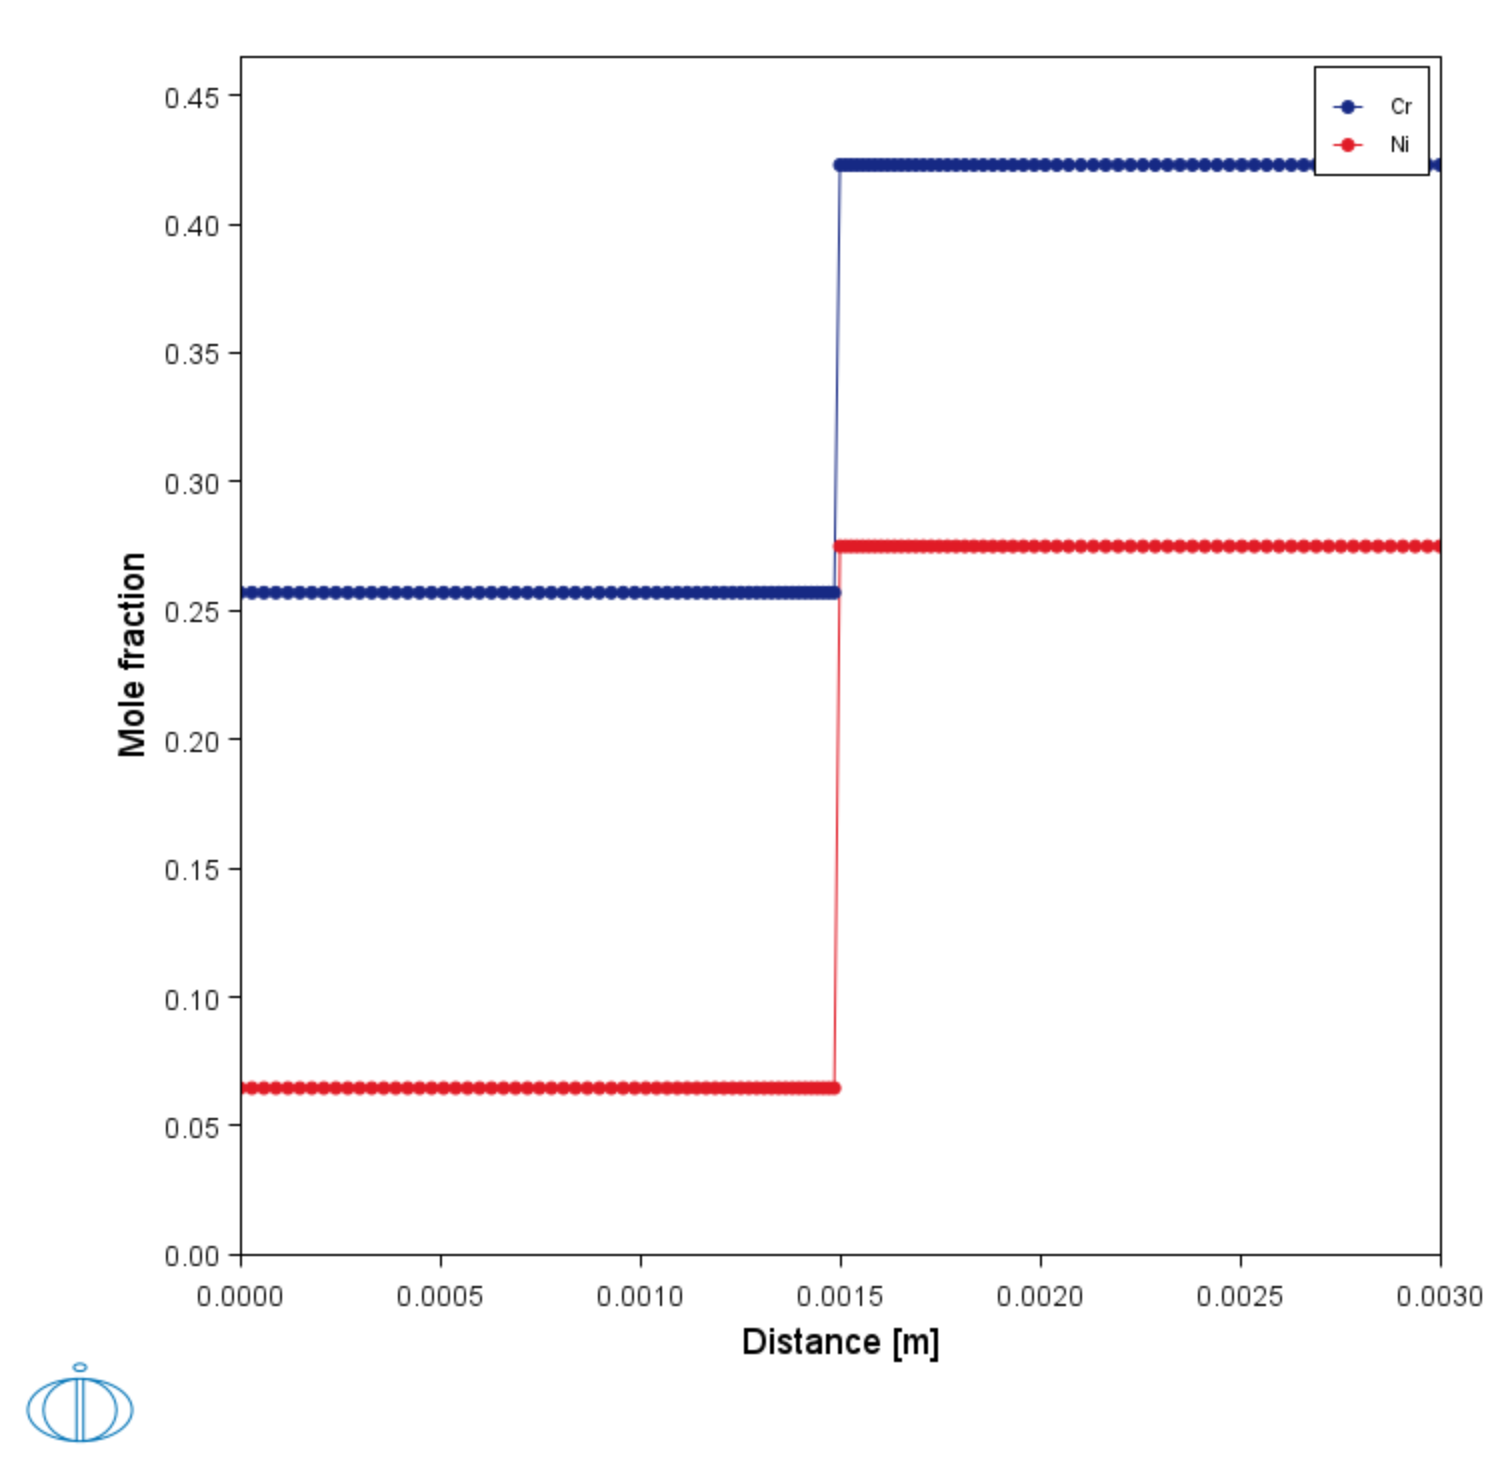
During set up of the calculation, you can preview the Composition Profile (shown) or Thermal Profile. Click the tab(s) in the Visualizations window to switch between these previews and adjust settings on the Diffusion Calculator Configuration window. For an Isothermal Thermal Profile this shows the constant temperature as entered.


