Plot Renderer Settings (Single Phase)
After you have completed the settings for the System Definer and Diffusion Calculator you define the plot parameters and run (perform) the simulation.
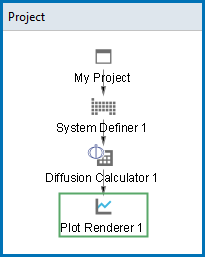
- In the Project window, right click the Diffusion Calculator node and select Create New Successor → Plot Renderer. A Plot Renderer node is added to the tree structure.
If you used the Diffusion template, then this activity node is already there. Click the Plot Renderer node to access the Configuration window settings.
For this first example, some of the defaults are kept and there are only two settings to add. In most cases, either a specific position in the domain or one or more specific times must be specified depending on whether time or spatial position is chosen as independent (X-axis) variable.
- In the Axes section for Y and next to Composition, choose Ni.
- In the Value(s) field, enter
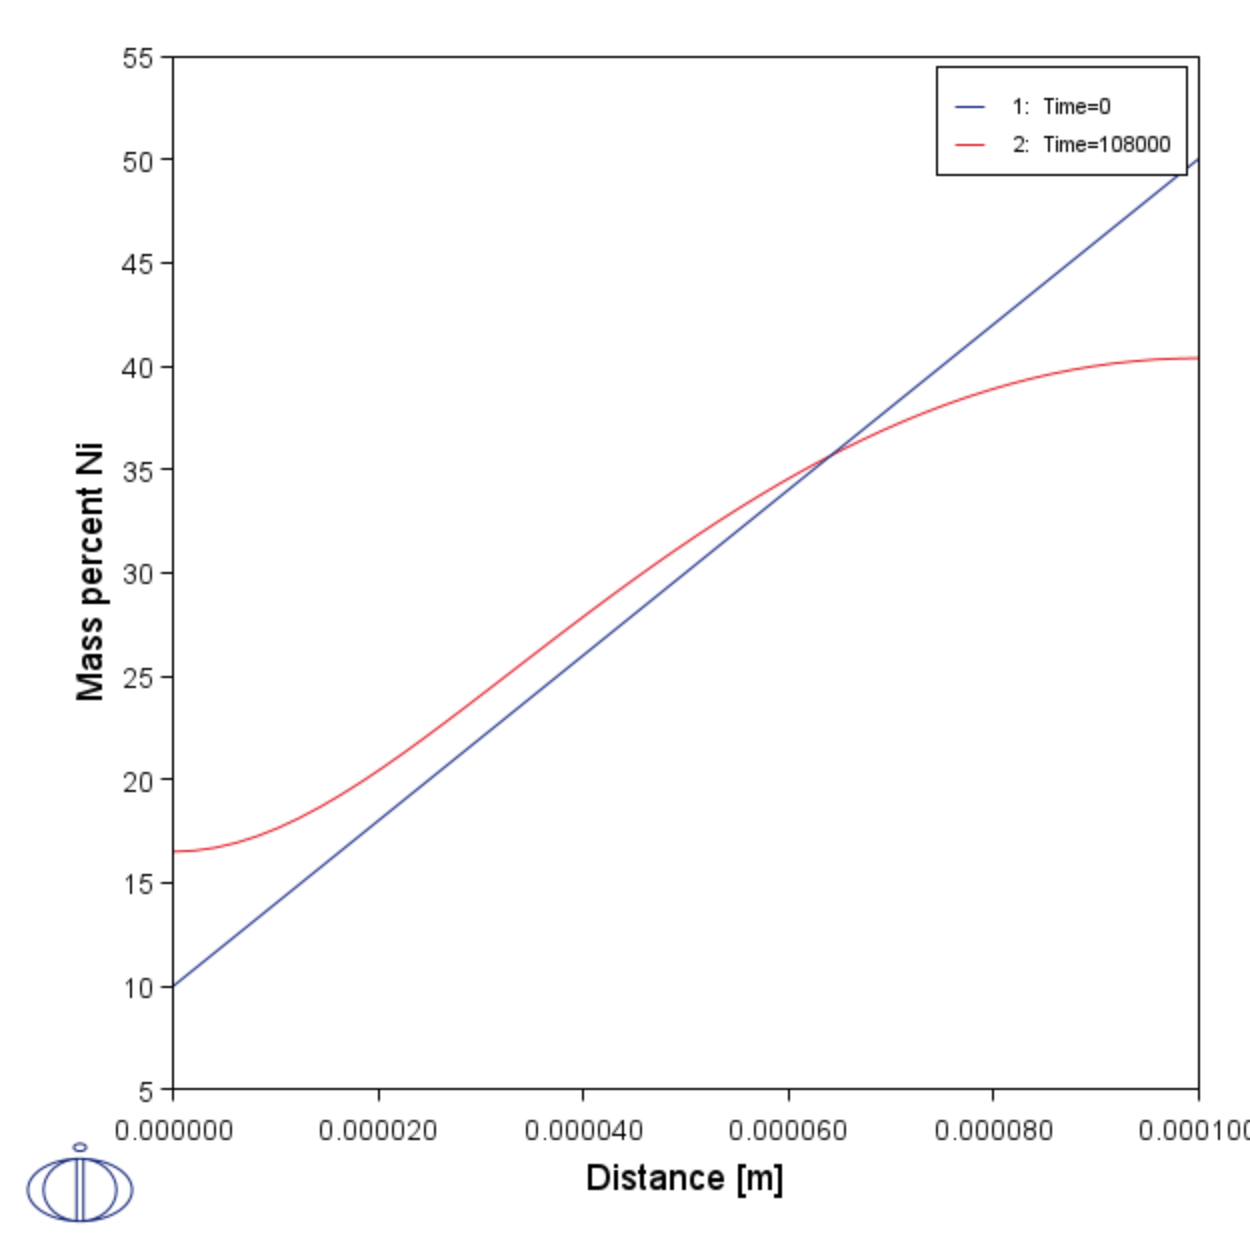
0.0before the30.0, which is automatically taken from the Diffusion Calculator setting. - Click Perform. If you have entered everything correctly, you will get this plot showing the composition profile of Ni at the initial (0 hours) and final time (30 hours or 108,000 seconds).


