PM_Ni_02: Antiphase Boundary Energy of γ'
The example uses the Property Model Calculator with the Antiphase Boundary Energy - Ni Model.
Property Model Calculator and About the Antiphase Boundary Energy Property Model
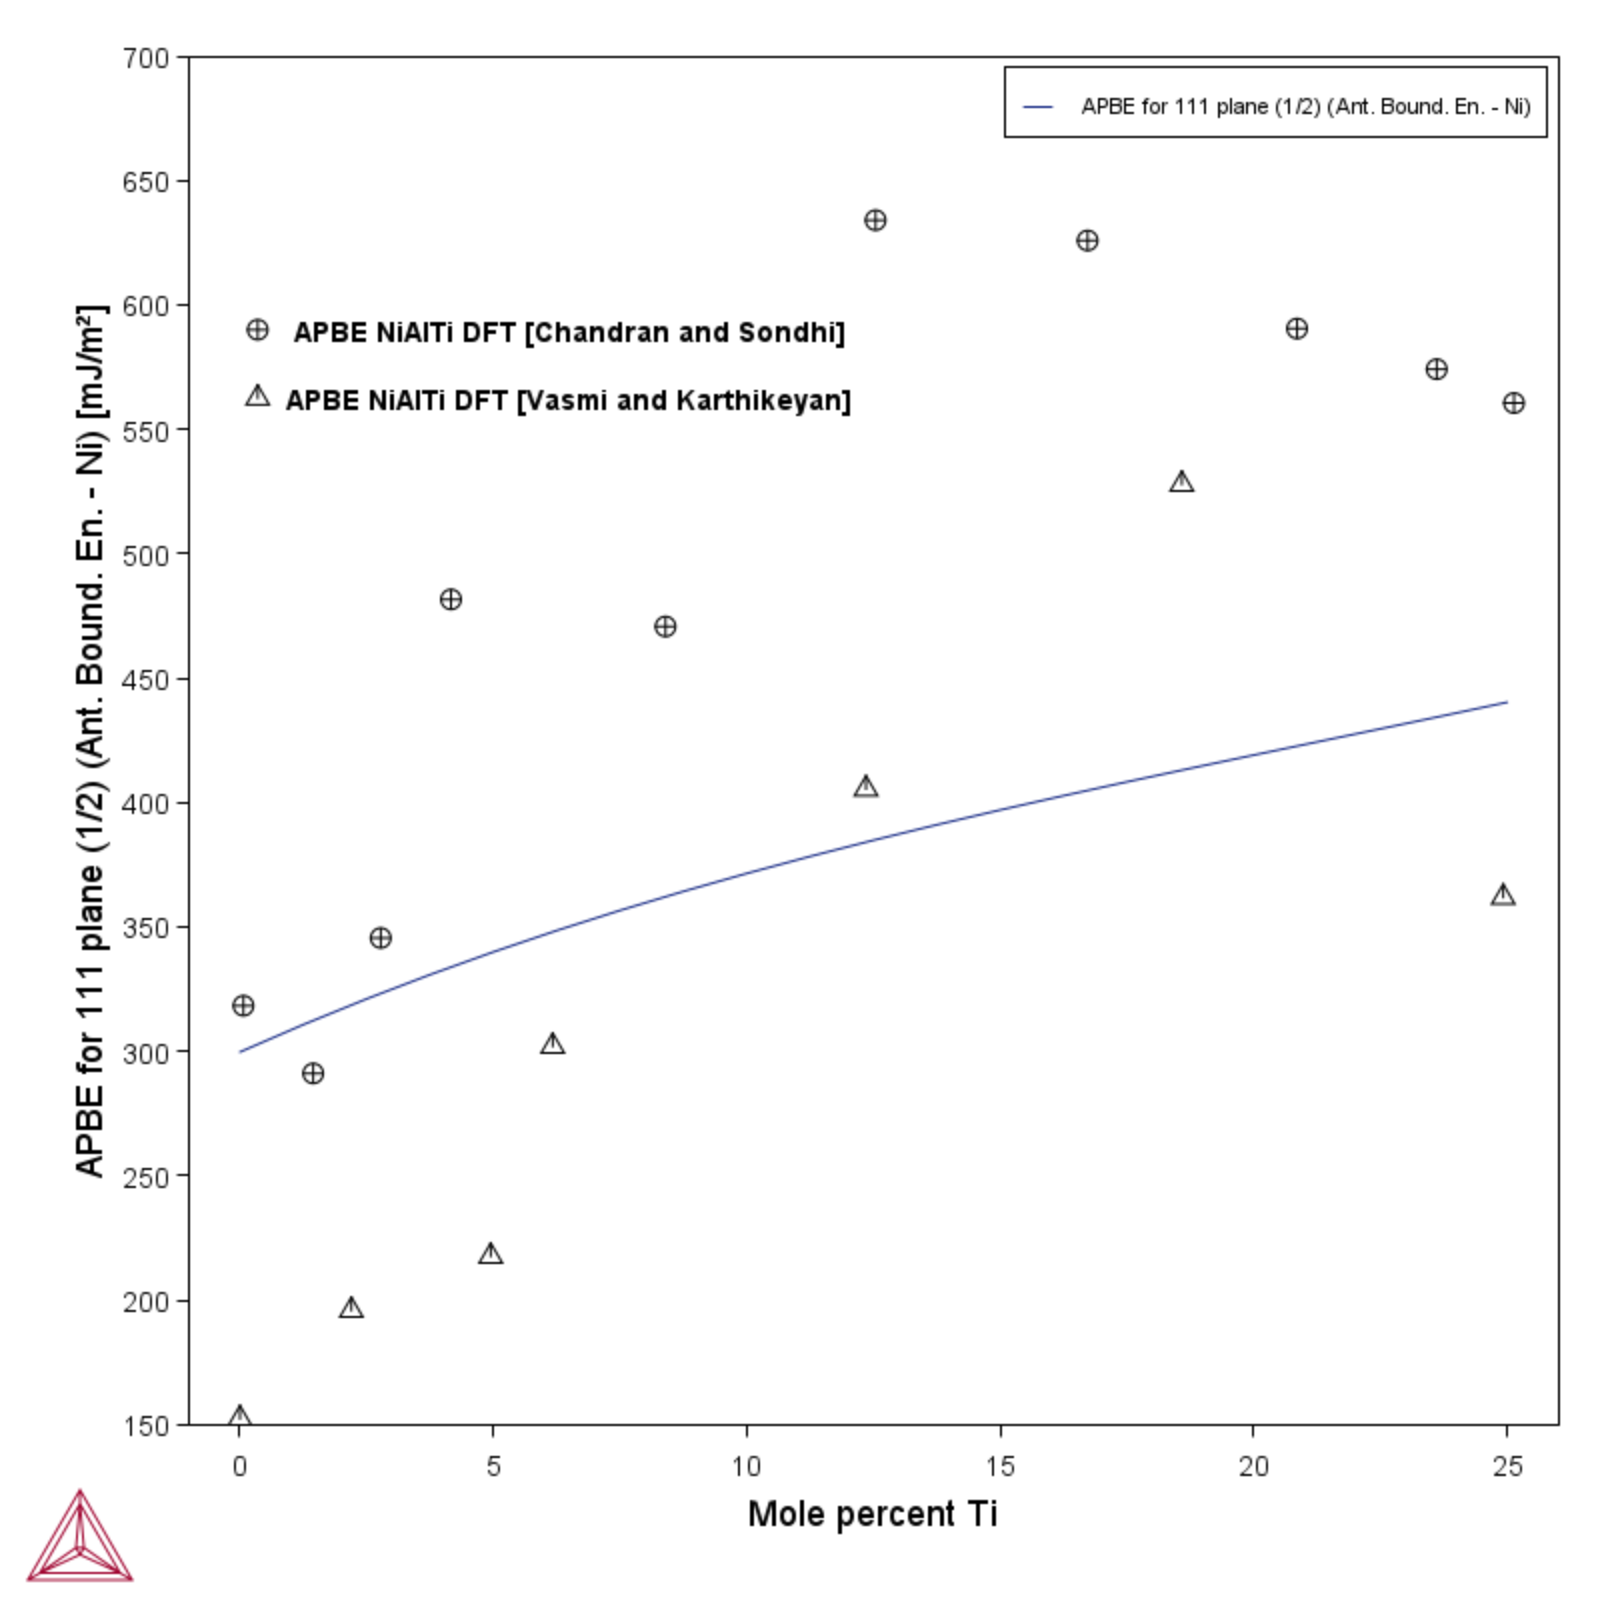
This example shows a calculation of the antiphase boundary energy for an Al75Ni alloy at room temperature with increasing amounts of Ti. The plot shows the (111) APB energy in Ni3Al1−xTix over the whole compositional range together with first-principle calculations from Chandran and Sondhi [2011Cha] and Vamsi and Karthikeyani [2012Vam] evaluated at 0 K. The trend with increasing 111 APBE with an increasing amount of Ti is predicted by all calculations but the absolute values between the first principle calculations are quite different.
Some of the key settings to note in this example:
- γ' is the only stable phase for these compositions. FCC_L12 is therefore selected as the only phase in the System Definer.
- The Freeze-in temperature and evaluation temperature are both set at 20 °C with the Subset of phases for All phases.
- A One Axis calculation is used with Mole percent Ti between 0 and 25 in 20 steps.
- The plotting quantity APBE for 111 plane (1/2) is then compared with the first principle calculations.
- Folder: Property Models → Nickel
- File name:
PM_Ni_02_Antiphase_Boundary_Energy_of_Gamma_Prime.tcu
To run calculations with the Nickel Models requires a valid maintenance license plus licenses for both the TCNI (version 11 and newer) and MOBNI (version 5 and newer) databases. For some Property Models, additional recommendations for the database version to use is indicated in its description. Also see our website to learn more about the Nickel Model Library.
Visualizations
Many of our Graphical Mode examples have video tutorials, which you can access in a variety of ways. When in Thermo‑Calc, from the menu select Help → Video Tutorials, or from the main My Project window, click Video Tutorials. Alternately, you can go to the website or our YouTube channel.
Open the example project file to review the node setup on the Project window and the associated settings on the Configuration window for each node. For some types of projects, you can also adjust settings on the Plot Renderer Configuration window to preview results before performing the simulation. Click Perform Tree to generate plots and tables to see the results on the Visualizations window.
Figure 1: Composition of Ti (mole %) compared to antiphase boundary surface energy for 111 plane and experimental data from [2011Cha; 2012Vam].
References
[2011Cha] M. Chandran, S. K. Sondhi, First-principle calculation of APB energy in Ni-based binary and ternary alloys. Model. Simul. Mater. Sci. Eng. 19, 025008 (2011).
[2012Vam] K. V. Vamsi, S. Karthikeyan, Effect of Off-Stoichiometry and Ternary Additions on Planar Fault Energies in Ni3Al, in Superalloys 2012 (John Wiley & Sons, Inc., Hoboken, NJ, USA, 2012; pp. 521–530.
