PM_Ni_04: Strain Age Cracking (SAC)
The example uses the Property Model Calculator with the Strain-Age Cracking - Ni Model.
For additional information, see About the Strain-Age Cracking Property Model.
Welding or additive manufacturing (AM) of Ni-base alloys has so far been strongly limited by various cracking issues during processing or post-processing. Strain-age cracking (SAC) occurs when the combination of thermal stresses and coherency stresses between the γ matrix and γ’ precipitates exceed the local strength of the alloy structure. Thermal residual stresses originate from the initial processing (welding or AM), while coherency stresses form during post-processing heat treatments, when γ’ re-precipitates in the matrix. Coherency stresses may be tensile or compressive depending on the sign of the lattice misfit.
Furthermore, coherency stresses scale with the fraction of γ’, making conventional high-γ’ alloys virtually impossible to weld or shape via AM. At the same time, high-γ’ fraction alloys offer attractive properties, such as high strength at high service temperatures. In order for such alloys to be processable, it is necessary to reduce the cracking tendency.
Thermal stresses are very difficult to alleviate, as this requires heating, which in turn triggers re-precipitation of γ’. Therefore, an alternative strategy may be to target the coherency stresses, which are determined by the respective lattice parameters of the matrix and precipitate. Such a strategy was adopted by Zhou et al. [2020Zho], where they optimized the composition of the Ni-base alloy to fulfill the above criteria, i.e., high fraction of γ’ and no strain-age cracking tendency.
In this example, the experimental alloys from [2020Zho] are analyzed based on the Strain-Age Cracking - Ni Property Model to compare the tendency for cracking using an SAC risk factor.
- Folder: Property Models → Nickel
- File name:
PM_Ni_04_Strain_Age_Cracking.tcu
To run calculations with the Nickel Models requires a valid maintenance license plus licenses for both the TCNI (version 11 and newer) and MOBNI (version 5 and newer) databases. For some Property Models, additional recommendations for the database version to use is indicated in its description. Also see our website to learn more about the Nickel Model Library.
This example uses TCNI12, but in general can be run with version 11 (TCNI11) and newer databases.
Visualizations
Many of our Graphical Mode examples have video tutorials, which you can access in a variety of ways. When in Thermo‑Calc, from the menu select Help → Video Tutorials, or from the main My Project window, click Video Tutorials. Alternately, you can go to the website or our YouTube channel.
Open the example project file to review the node setup on the Project window and the associated settings on the Configuration window for each node. For some types of projects, you can also adjust settings on the Plot Renderer Configuration window to preview results before performing the simulation. Click Perform Tree to generate plots and tables to see the results on the Visualizations window.
Performing the calculation for the two experimental alloys, along with the CM247LC benchmark alloy and using the temperature interval setting produces a set of relevant output results as shown in a table (Figure 1) and Parallel coordinates plot (Figure 2). CM247LC is considered to be very difficult to weld, which is evidenced by the very high value of the SAC risk factor. Comparatively, the two experimental alloys, ExpAM and ExpAMmod, show values very close to zero. Low or negative values of the SAC risk factor can be interpreted as low or no risk for strain-age cracking.
Conventionally, the weldability of a given Ni-base alloy has been assessed based on the Ti and Al contents, which correlate with the fraction of γ’. However, such an approach neglects the fact that it is the coherency stresses that cause cracking, and these are also dependent on the lattice misfit. By tailoring an alloy to have low misfit, in relation to the γ’ fraction and in the relevant temperature range, it is possible to design a high-γ’ fraction alloy with very low risk for SAC, as shown in [2020Zho]. The SAC model used here captures all of these effects and can be used as a design tool for the purpose of eliminating this cracking tendency.

Figure 1: There are a two ways to view the data in table format. In this example, there is a Table Renderer node added to the Project window that lists the data points in the Visualizations window.
You can also access the same information via the Plot Renderer Configuration window by clicking the Table View button followed by clicking Perform. This converts the Parallel coordinates plot type to the same table of information.
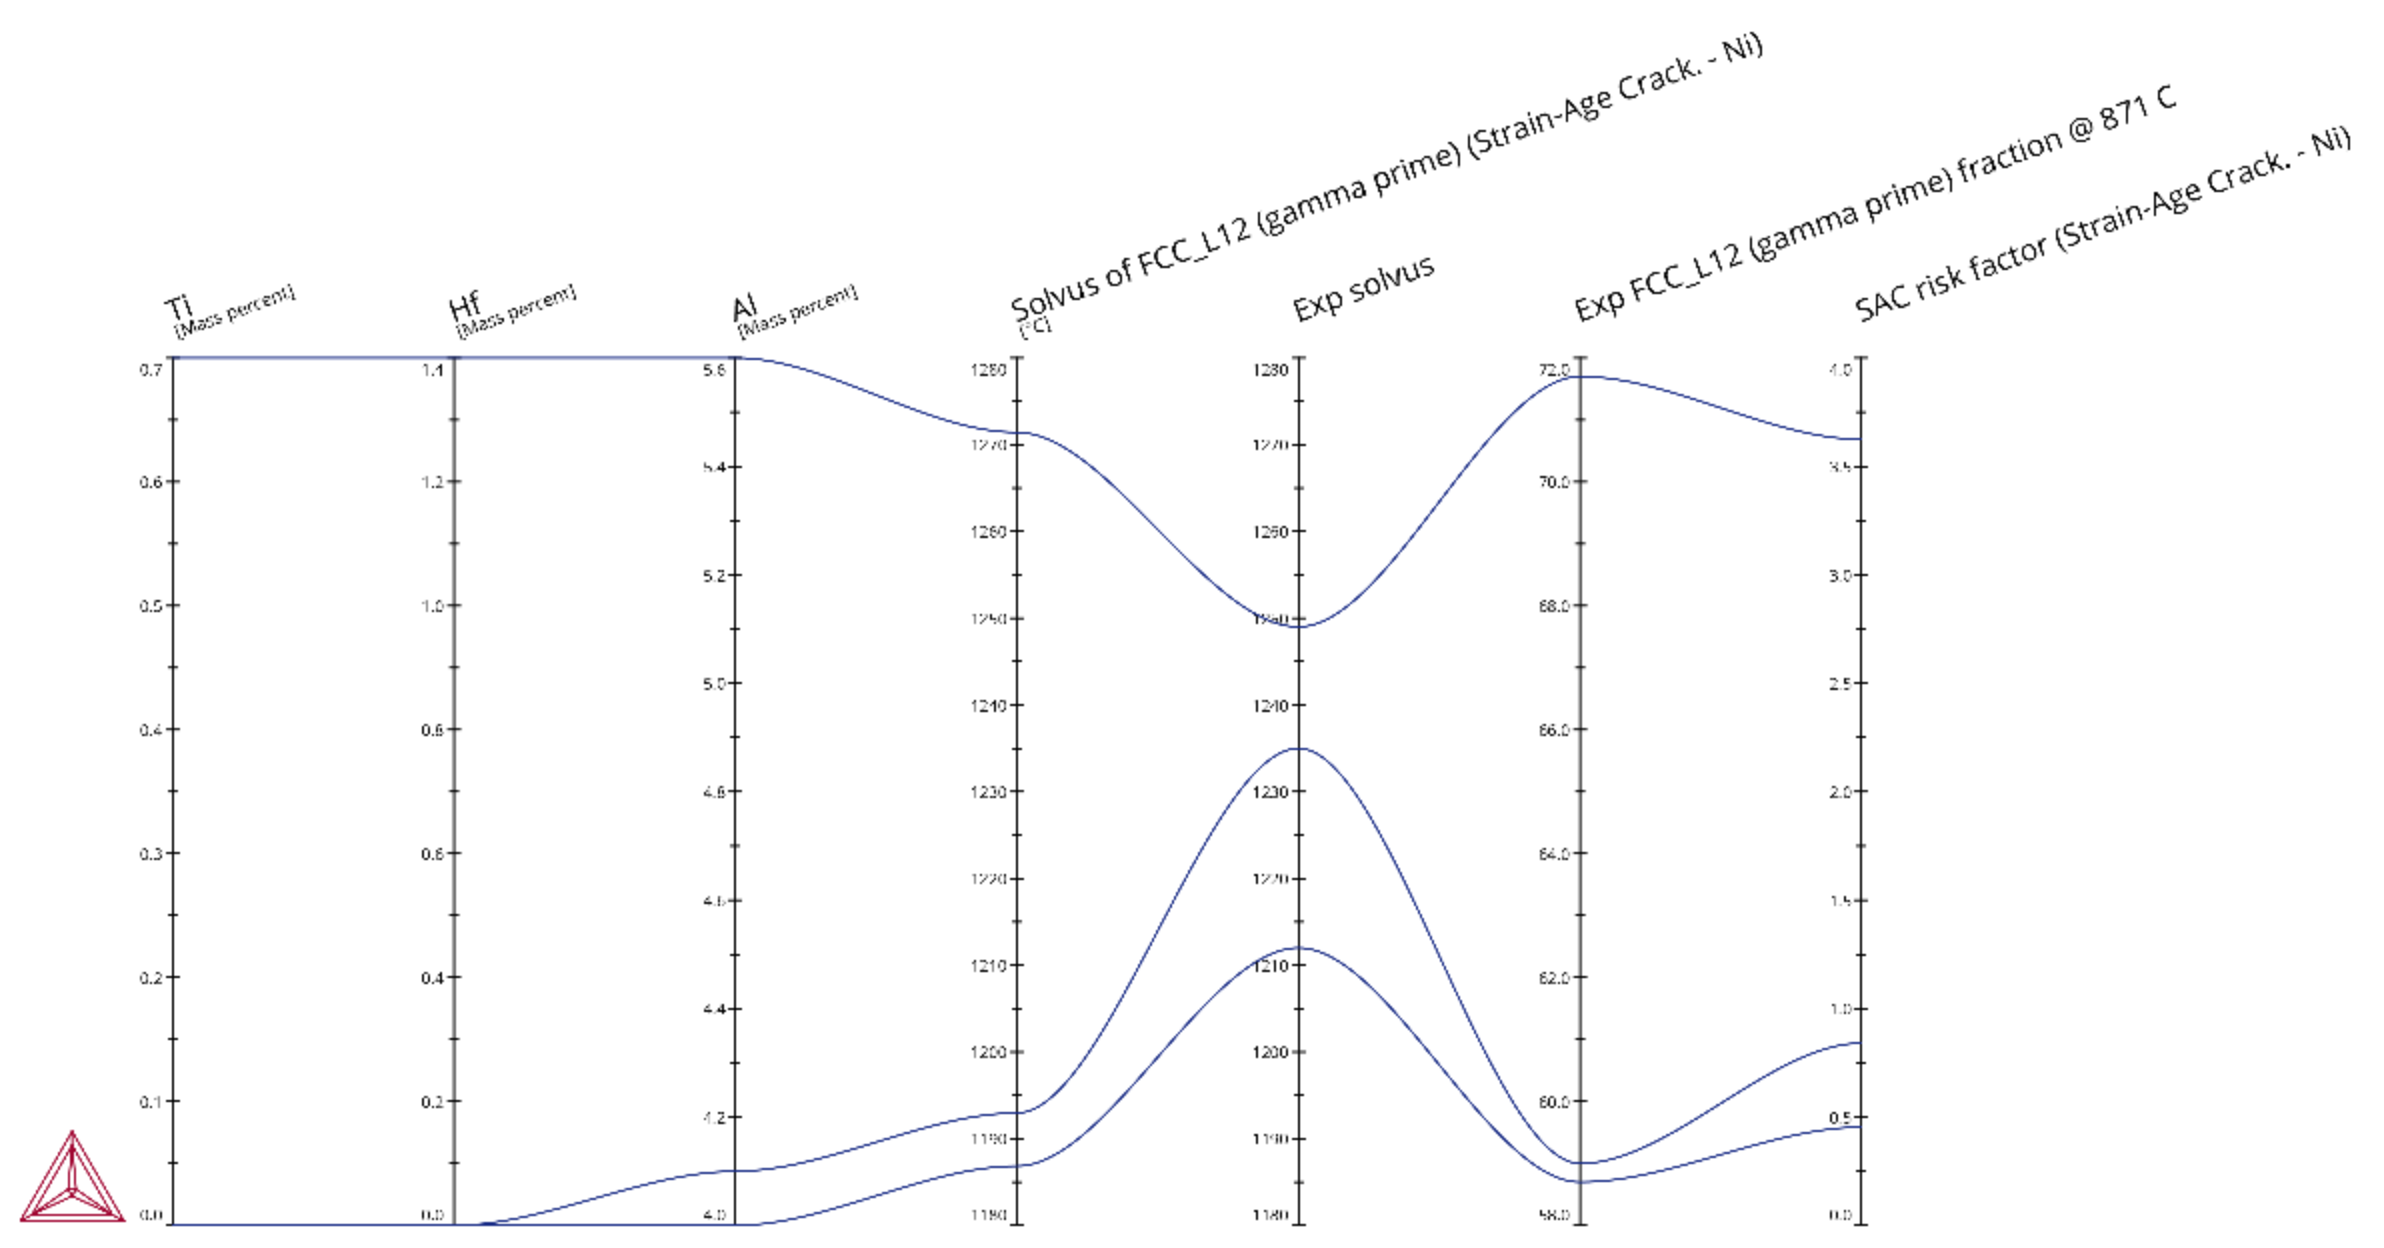
Figure 2: Parallel plot of the resulting SAC risk factor along with experimental and calculated solvus of γ’ for the three alloys compared in [2020Zho].
Plot Type: Parallel Coordinates
Reference
[2020Zho] N. Zhou, A. D. Dicus, S. A. J. Forsik, T. Wang, G. A. Colombo, M. E. Epler, Development of a New Alumina-Forming Crack-Resistant High-γ′ Fraction Ni-Base Superalloy for Additive Manufacturing, in Superalloys 2020, pp. 1046–1054.