The Graphical Mode Desktop Layout
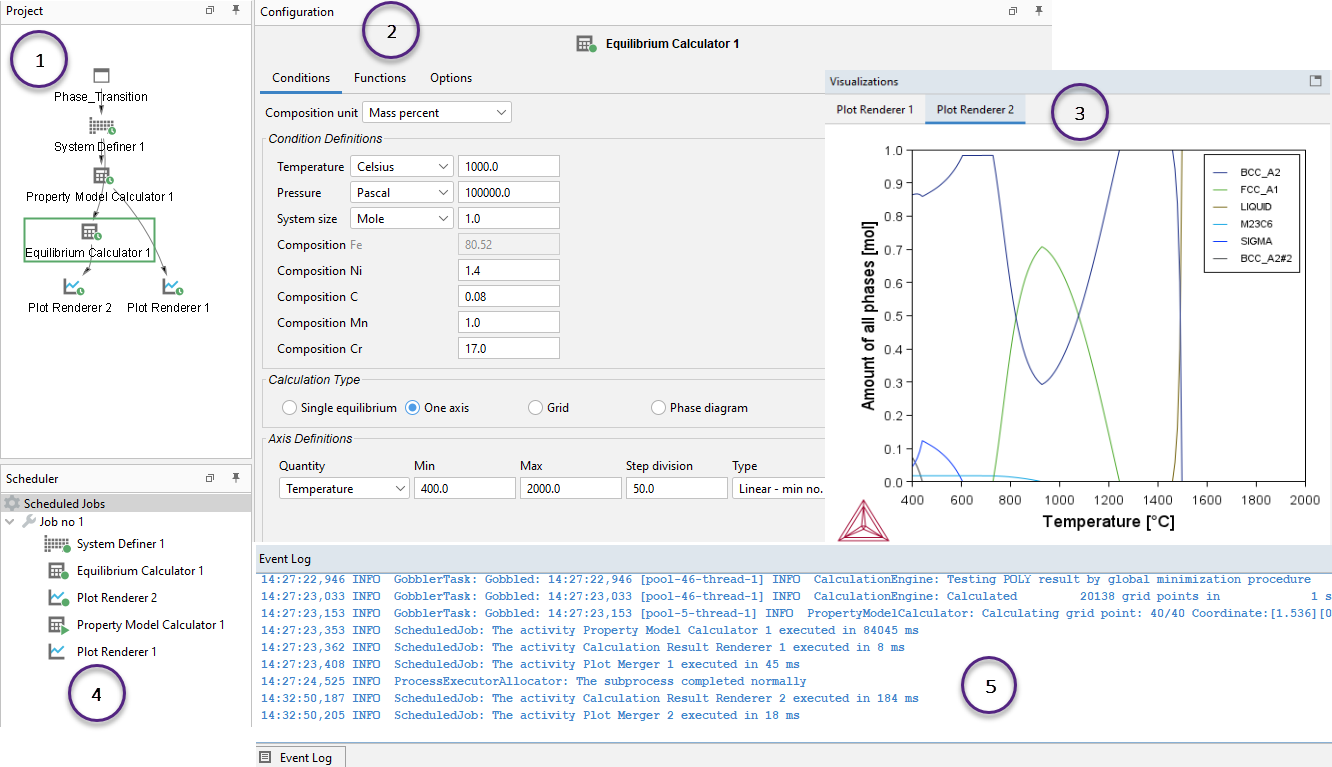
Open Thermo‑Calc to view the default graphical user interface (GUI) layout for Graphical Mode. The windows are:
- Project: Create, make changes, and navigate between the activities that make up a project. Click the My Project node to access the Quick Start wizard, a variety of templates to create projects for all the calculator types, and several other resources.
- Configuration: Shows the settings that can be configured for the currently selected activity node, i.e. when you click the Equilibrium Calculator, the Configuration window has the settings for this node.
- Visualizations: Shows the results of a calculation, either plotted as a diagram or displayed in table format. For some types of calculations, there are also previews of settings shown in this window. In this example, there is only a Plot Renderer tab in the Visualizations window.
Previews in the Visualizations window are applicable to some of the Add-on Modules, i.e. for the Diffusion Calculator, Precipitation Calculator, and AM Calculator. The information is detailed in the relevant sections of the documentation.
- Scheduler: Displays information about jobs, such as calculations, that are being performed or are scheduled to be performed. You can cancel scheduled jobs and if a job has failed, then you can view information about the error.
- Event Log: By default this window is closed but it displays during calculation processes. You can always open it to view progress of calculations and to troubleshoot.
In this example, the Visualizations window also has a Plot Renderer tab. You can also have a Table Renderer tab and when working with calculations that have specialized settings, these tabs are also included and match the names of the nodes in the Project window.
Organizing the Windows on the Desktop and Getting Started Links and Templates
