Menu or Keyboard Options: Geometry and 3D Plots
When working with the AM Calculator (probes) and its associated Plot Renderer (for 3D Plots), there are menu options or tooltip guidelines available to access certain actions for probes, markers, or to save a snapshot image from the Visualizations window.
Plot- and Geometry-related Menus to Save Images
When available, right-click in the Visualizations window and choose Save As from the menu to save the current view in png, gif, or jpg format. This saves an image snapshot of the 3D Plot or Geometry at the zoom level and angle you are currently viewing.
- Geometry: When setting up probes, you can right-click on the Geometry to save the current view.
- 3D Plot: When working with a 3D Plot, you can right-click anywhere on the 3D Plot to save the current view. This option is only available with AM Calculator 3D plots.
Probe-related Menus and Tooltips
AM Calculator: Working with Probe Data
When you are picking the coordinates for the probe location, there is a menu available when you right-click a point on the Geometry in the Visualizations window. There are also tooltips that can help guide you.
- On the Configuration window for an AM Calculator, under Probe Positions, click Pick coordinate. Hover over the button to view the tooltips with options to:
- Double-click on the geometry to pick a coordinate.
- Hold the <Ctrl> key and double-click to pick the position at the middle of a layer.
- Hold the <Shift> key and double-click to map the picking position with a scanning path.
- Hold the <Shift+Alt> keys and double-click to map the picking position to the middle of the scanning path.
- In the Visualizations window on the Geometry tab, use one of the methods to add a probe point to the geometry, for example double-click to add a probe.
- In the Visualizations window, right-click to choose an option from the menu associated to the new Pick coordinate probe point:
- Set probe to this position: Sets to the location where the probe is located at the time of selecting.
- Set probe to the nearest path line: Moves the probe to the path line, which can be where other probes are already set up.
- Set probe to the middle of the two nearest path lines: This only works if there are two path lines, otherwise the probe does not move.
- Save As...: Select this to save an image of the current view of the probes (a snapshot at the zoom level chosen). You can save in png, gif, or jpg formats.
- Close : Closes this menu.
Marker-related Menus and Tooltips for 3D Plots (AM Module Only)
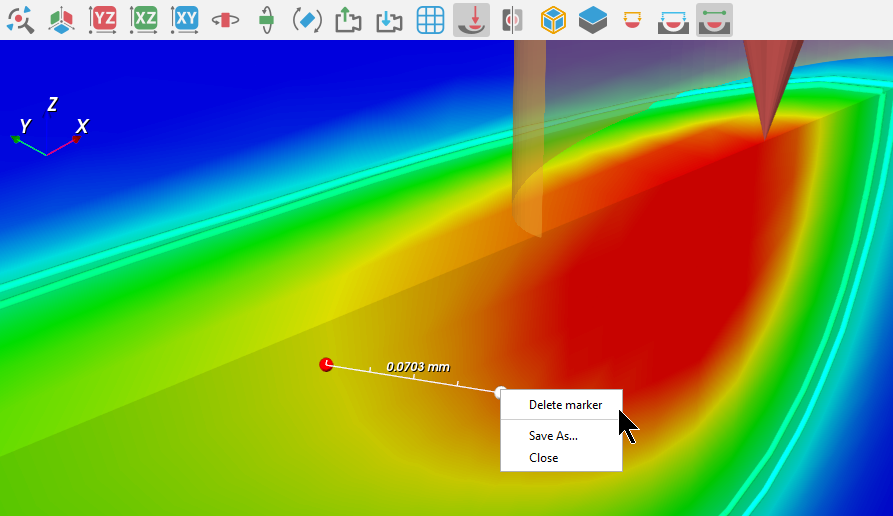
Markers are added to 3D plots in the Visualizations window. For example, you are measuring the distance between two points on a heat source.
- On the Visualizations window for an AM Calculator Plot Renderer (and after running a 3D Plot), click the Show Manual Ruler button on the toolbar. Hover over the button to view the tooltips with options to:
- Double-click each time to add the start and end points.
- To align a ruler on the x-, y-, or z-axis: Hold <Ctrl> when adding or moving the end point. The ruler snaps to the closest point on the same axis.
- To move a ruler: Click and hold a point, then drag to reposition.
- Right-click a point to delete the ruler.
- Click in the plot area to add markers for the start and end points, for example. Once the marker is on the plot, you can delete it or save an image of the plot at the current view.
- To delete a marker, zoom as close to it as possible and right-click the marker to bring up the menu. Select Delete marker from the list. You might have to move the mouse around the area of the marker or zoom further to access the menu options.
- To save an image of the plot at the current view, click anywhere in the plot and select Save as. Select this to save an image in png. gif, or jpg format.

