Visualizing Batch Calculations in the AM Module
This topic describes the AM Calculator visualizations related to the Batch calculations for a Steady-state simulation. There are further settings and visualization possibilities s that are available when you are working on the Plot Renderer.
To import data for use in batch calculations, it is recommended you review AM Calculator Experiment File Requirements. Also review Working with AM Visualizations, which provides an overview of how most of the windows are connected.
It is recommended to open and run one of the examples to best understand the wide variety of visualization outcomes.
AM_07: Batch Calculations for an IN718 Alloy, AM_08b: Batch Calculations for a Ti64 Alloy, and AM_09b: Batch Calculations for an SS316L Alloy.
Working with AM Calculator Batch Experiment Data
From example AM_08b, where the general behavior related to importing data to the table is the same as other places in Thermo‑Calc.
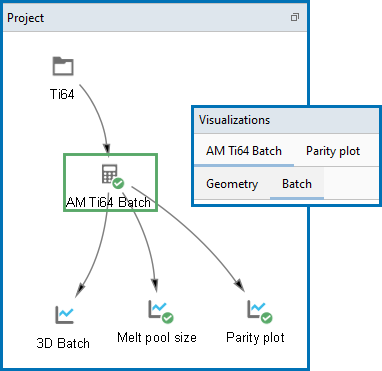
In the Project window, click the relevant AM Calculator node (in this example renamed to AM Ti64 Batch) to work on the Configuration window and preview the table data via a Batch tab on the Visualizations window.
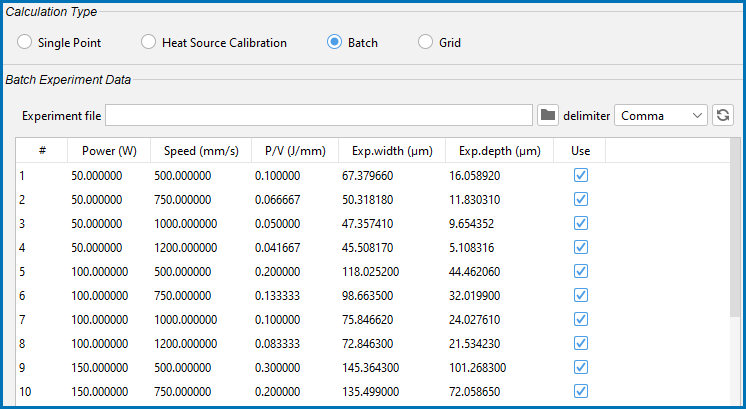
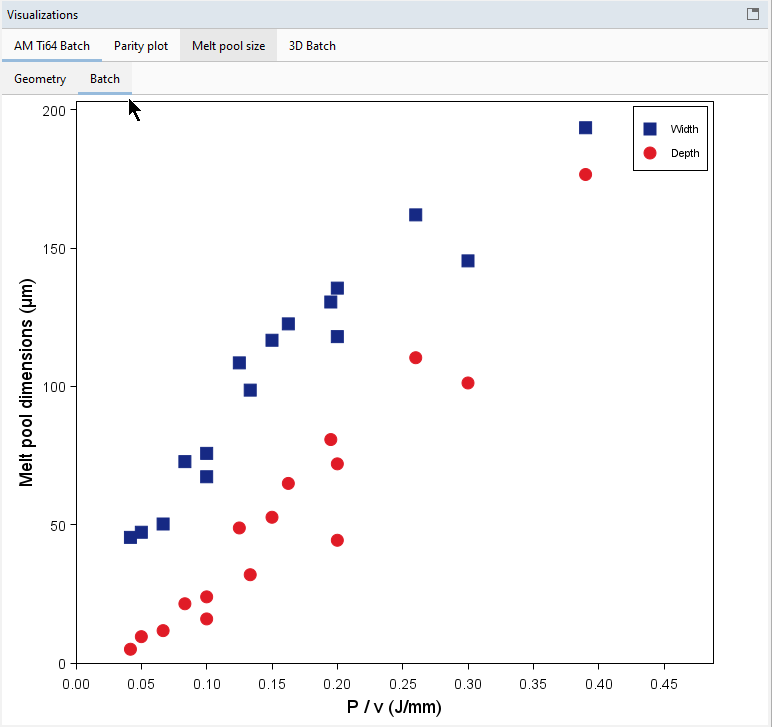
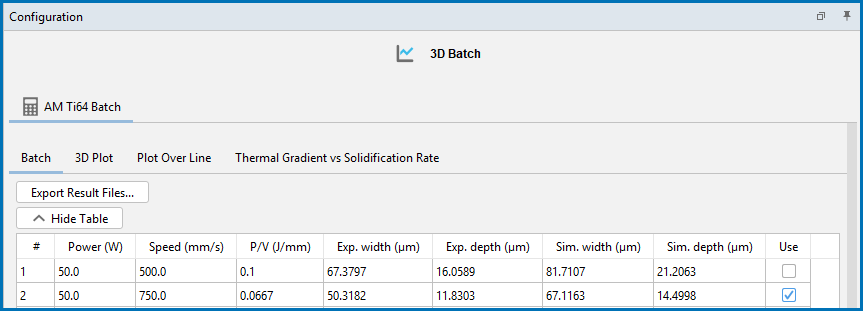
During the set up of a calculation, the Batch Experiment Data is imported into the AM Calculator Configuration window, where you can review the data and choose to include or exclude data points by selecting and deselecting the checkboxes as needed in the Use column (see Figure 1). At the same time, you can observe the change as this is updated in the Visualizations window (see Figure 2). Data can also be entered directly into the table.
Figure 1: The experimental data used for the Batch calculation for the single track experiments of Ti64 is imported to the AM Calculator table where you can review the data points and include or exclude as needed using the checkboxes.
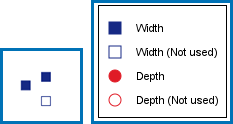
Figure 2: The visualization of the experimental melt pool dimensions are shown as a function of the energy density P/v. You can adjust the selected points in the Batch Experiment Data table and watch the updates dynamically in this window.
Including or Excluding Data Points
The following discusses visualization options available on the Configuration windows for both the AM Calculator and Plot Renderer.
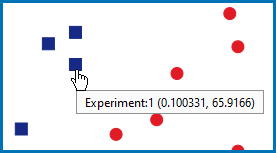
You can click or hover over any point on the Batch preview to display the label, which also includes the corresponding table row (i.e. Experiment) number for the point.
Use the table's Use column on the AM Calculator Configuration window to select the relevant checkboxes for which Width and Depth points to include (i.e. use) or exclude (i.e. not use).
Figure 3: From example AM_08b, on the AM Calculator, the checkbox for row (experiment) #1 can be deselected to exclude the data point in the calculations.
On the Batch tab on the Visualizations window, the preview shows the P/v on the X-axis and Melt pool dimensions on the Y-axis:
- Width uses blue squares (solid color means used, hollow with same color outline means not used)
- Depth uses red circles (solid color means used, hollow with same color outline means not used)
When you toggle the Use checkbox selection, the preview dynamically updates in the Visualizations window to indicate which data points are used (filled) or not used (hollow), both on the preview and in the legend.
The points that are selected in the Batch Experiment Data table are used in the simulation results and are later labeled Exp.Width and Exp.Depth in the Plot Renderer Configuration table (see Figure 4). Then the calculated results are added to new columns labeled Sim.Width and Sim.Depth.
Figure 4: From example AM_08b, this is the Batch tab on the Plot Renderer Configuration window where row (experiment) #1 data point is excluded from the results after selecting it on the AM Calculator. When a checkbox is not selected here, the results are also not included if you choose to export the result files. The details about Plot Renderer settings are in the topicAM Calculator: Plot Renderer Settings.
Working with the Batch Table on the Plot Renderer
After the Batch Experiment Data set up is completed on the AM Calculator and the simulation run, then on the Plot Renderer Configuration window you can start to work with the data you want to plot. Also see Including or Excluding Data Points to understand the interaction between these two tables.
For additional Plot Renderer settings (and other visualization options for plotting) go to Batch Calculations.
