Thermal Conductivity of Mg-Gd, Mg-Y, and Mg-Gd-Y
The thermophysical properties available with the TCS Mg-based Alloys Database (TCMG) include thermal conductivity.
Mg-Gd
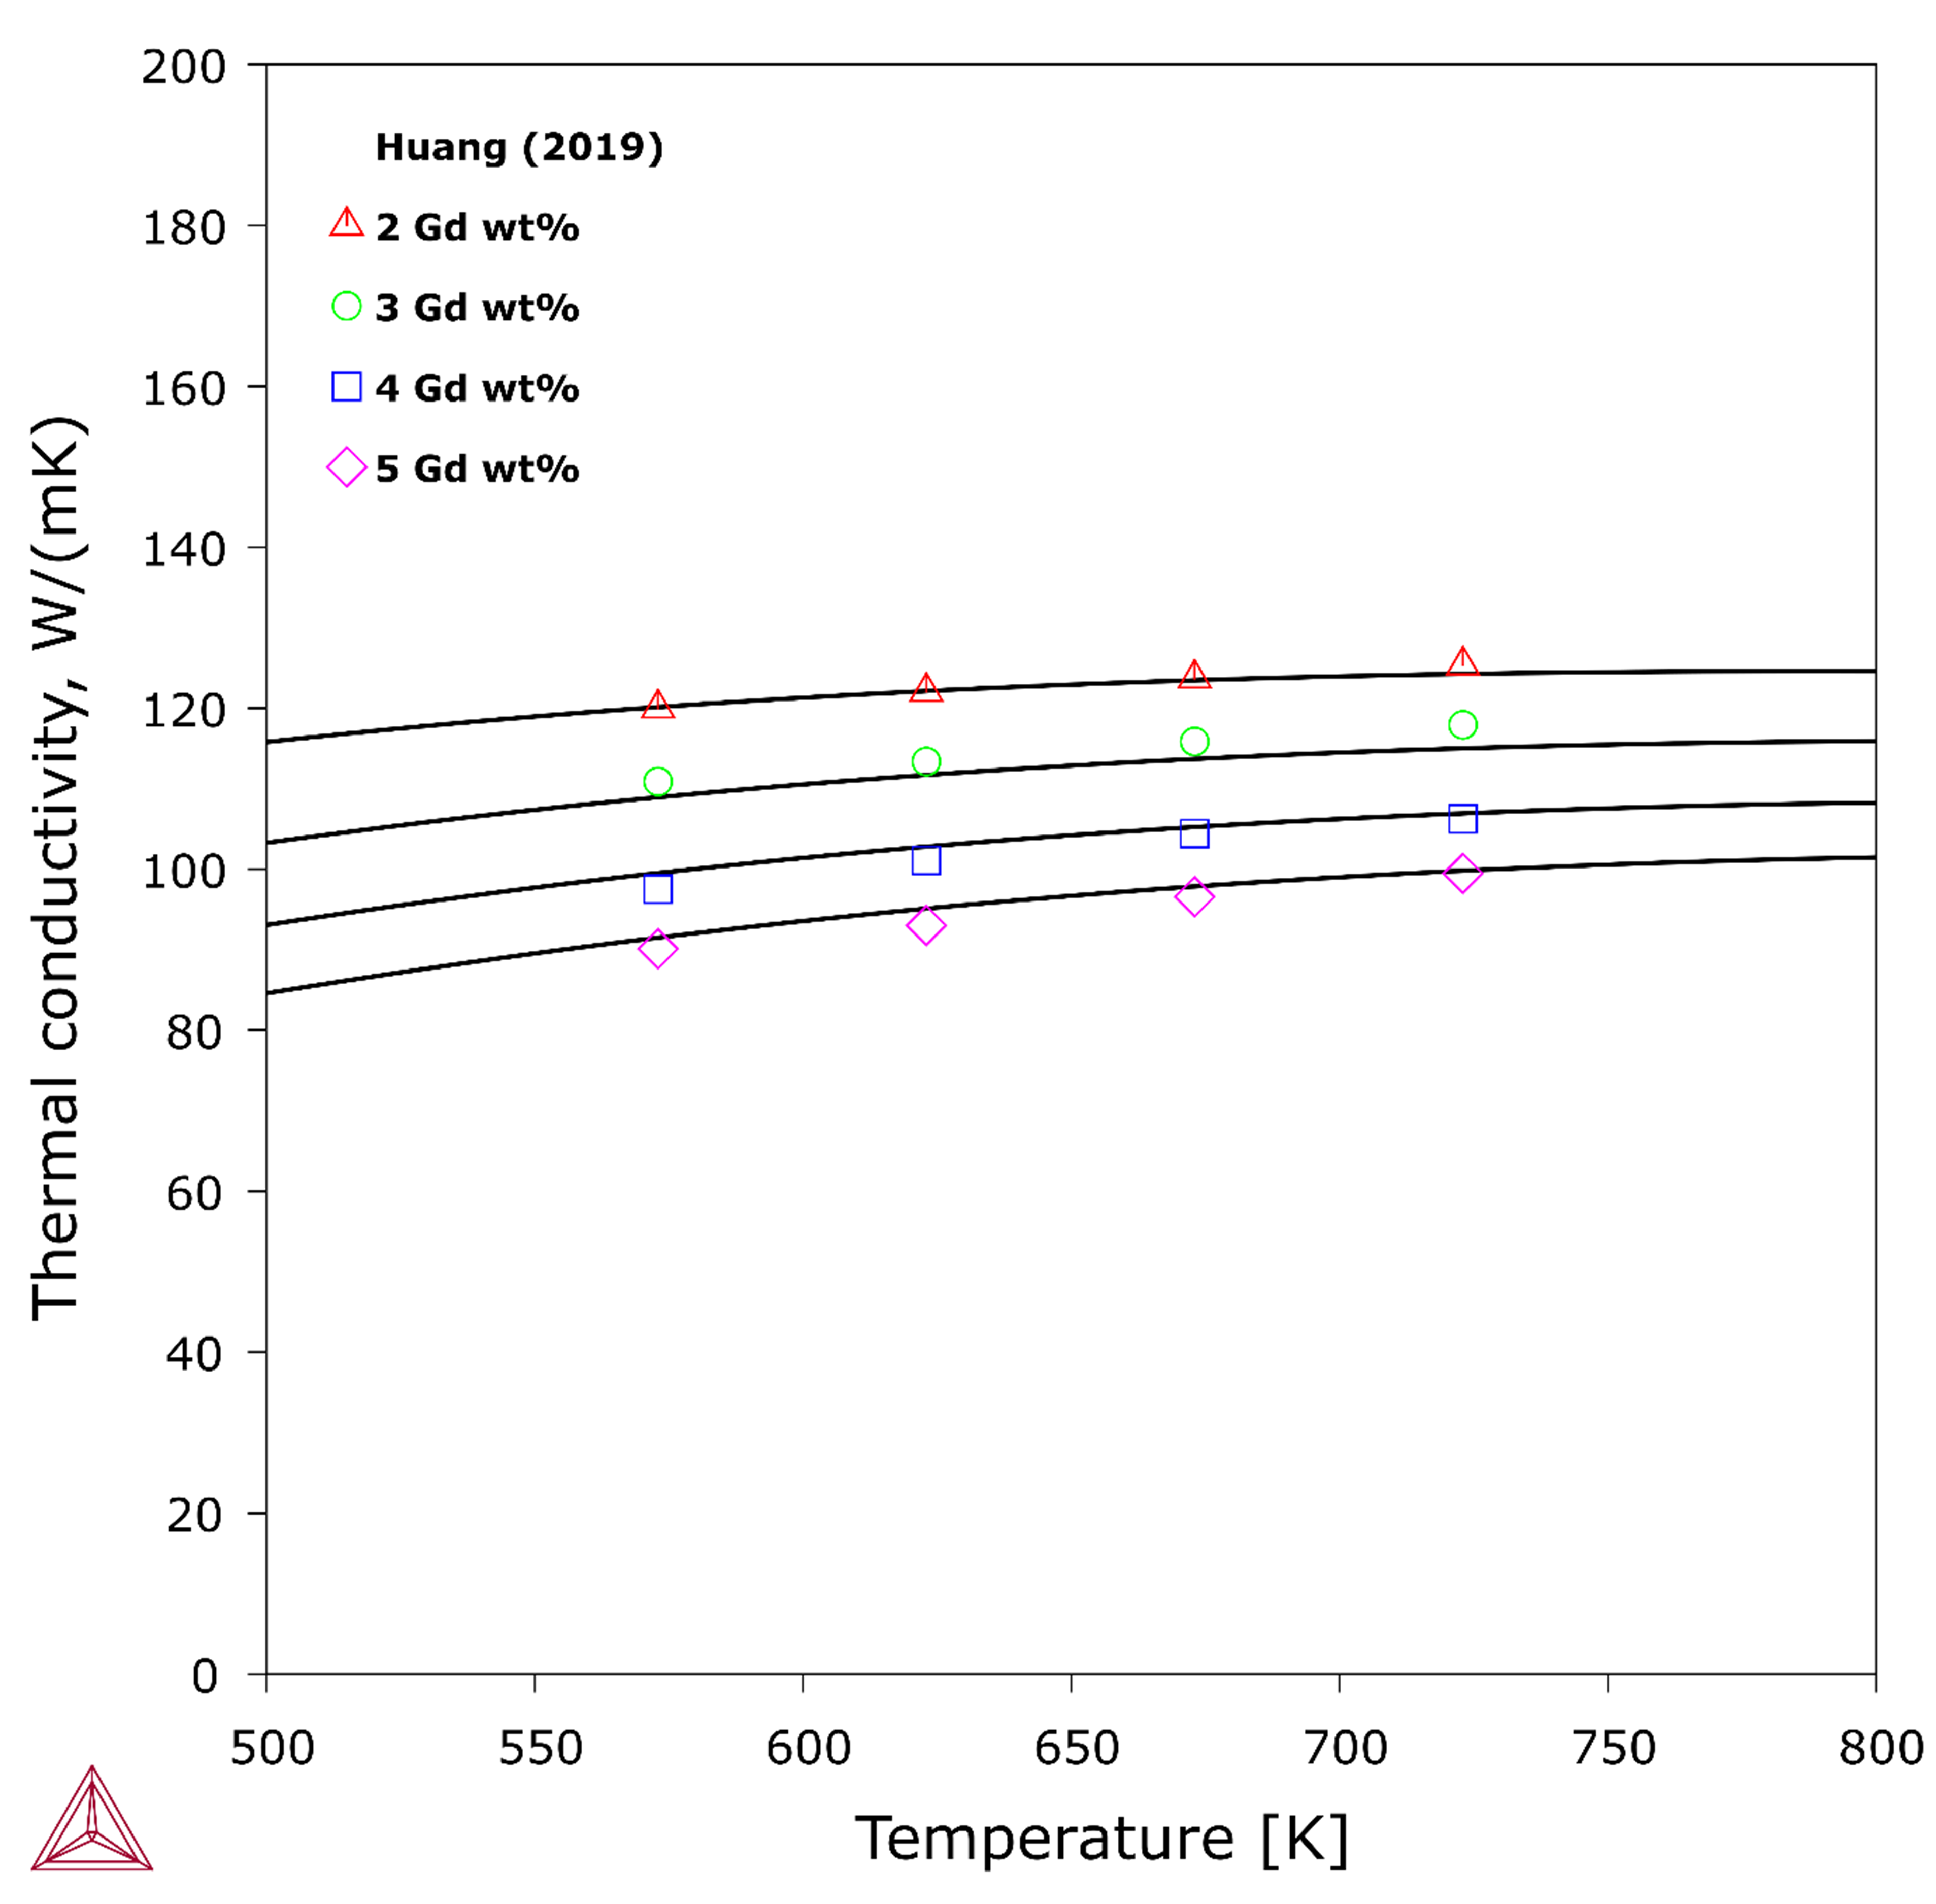
The thermal conductivity of Gd-Mg alloys was measured in two papers [201Zho and 2019Hua] with solution treated alloys (at 798 K for 24 hours or 673 K for 30 days, respectively). Some of the alloys are expected to consist of fully (Mg) solid solution while some contain also the intermetallic compound Mg5Gd. Figure 1 shows the calculated thermal conductivity of (Mg) at different Gd concentrations versus the temperature in comparison with the single-phase data from Huang [2019Hua].
Figure 1: Calculated thermal conductivity of HCP_A3 solution in the Mg-Gd system, versus the temperature.
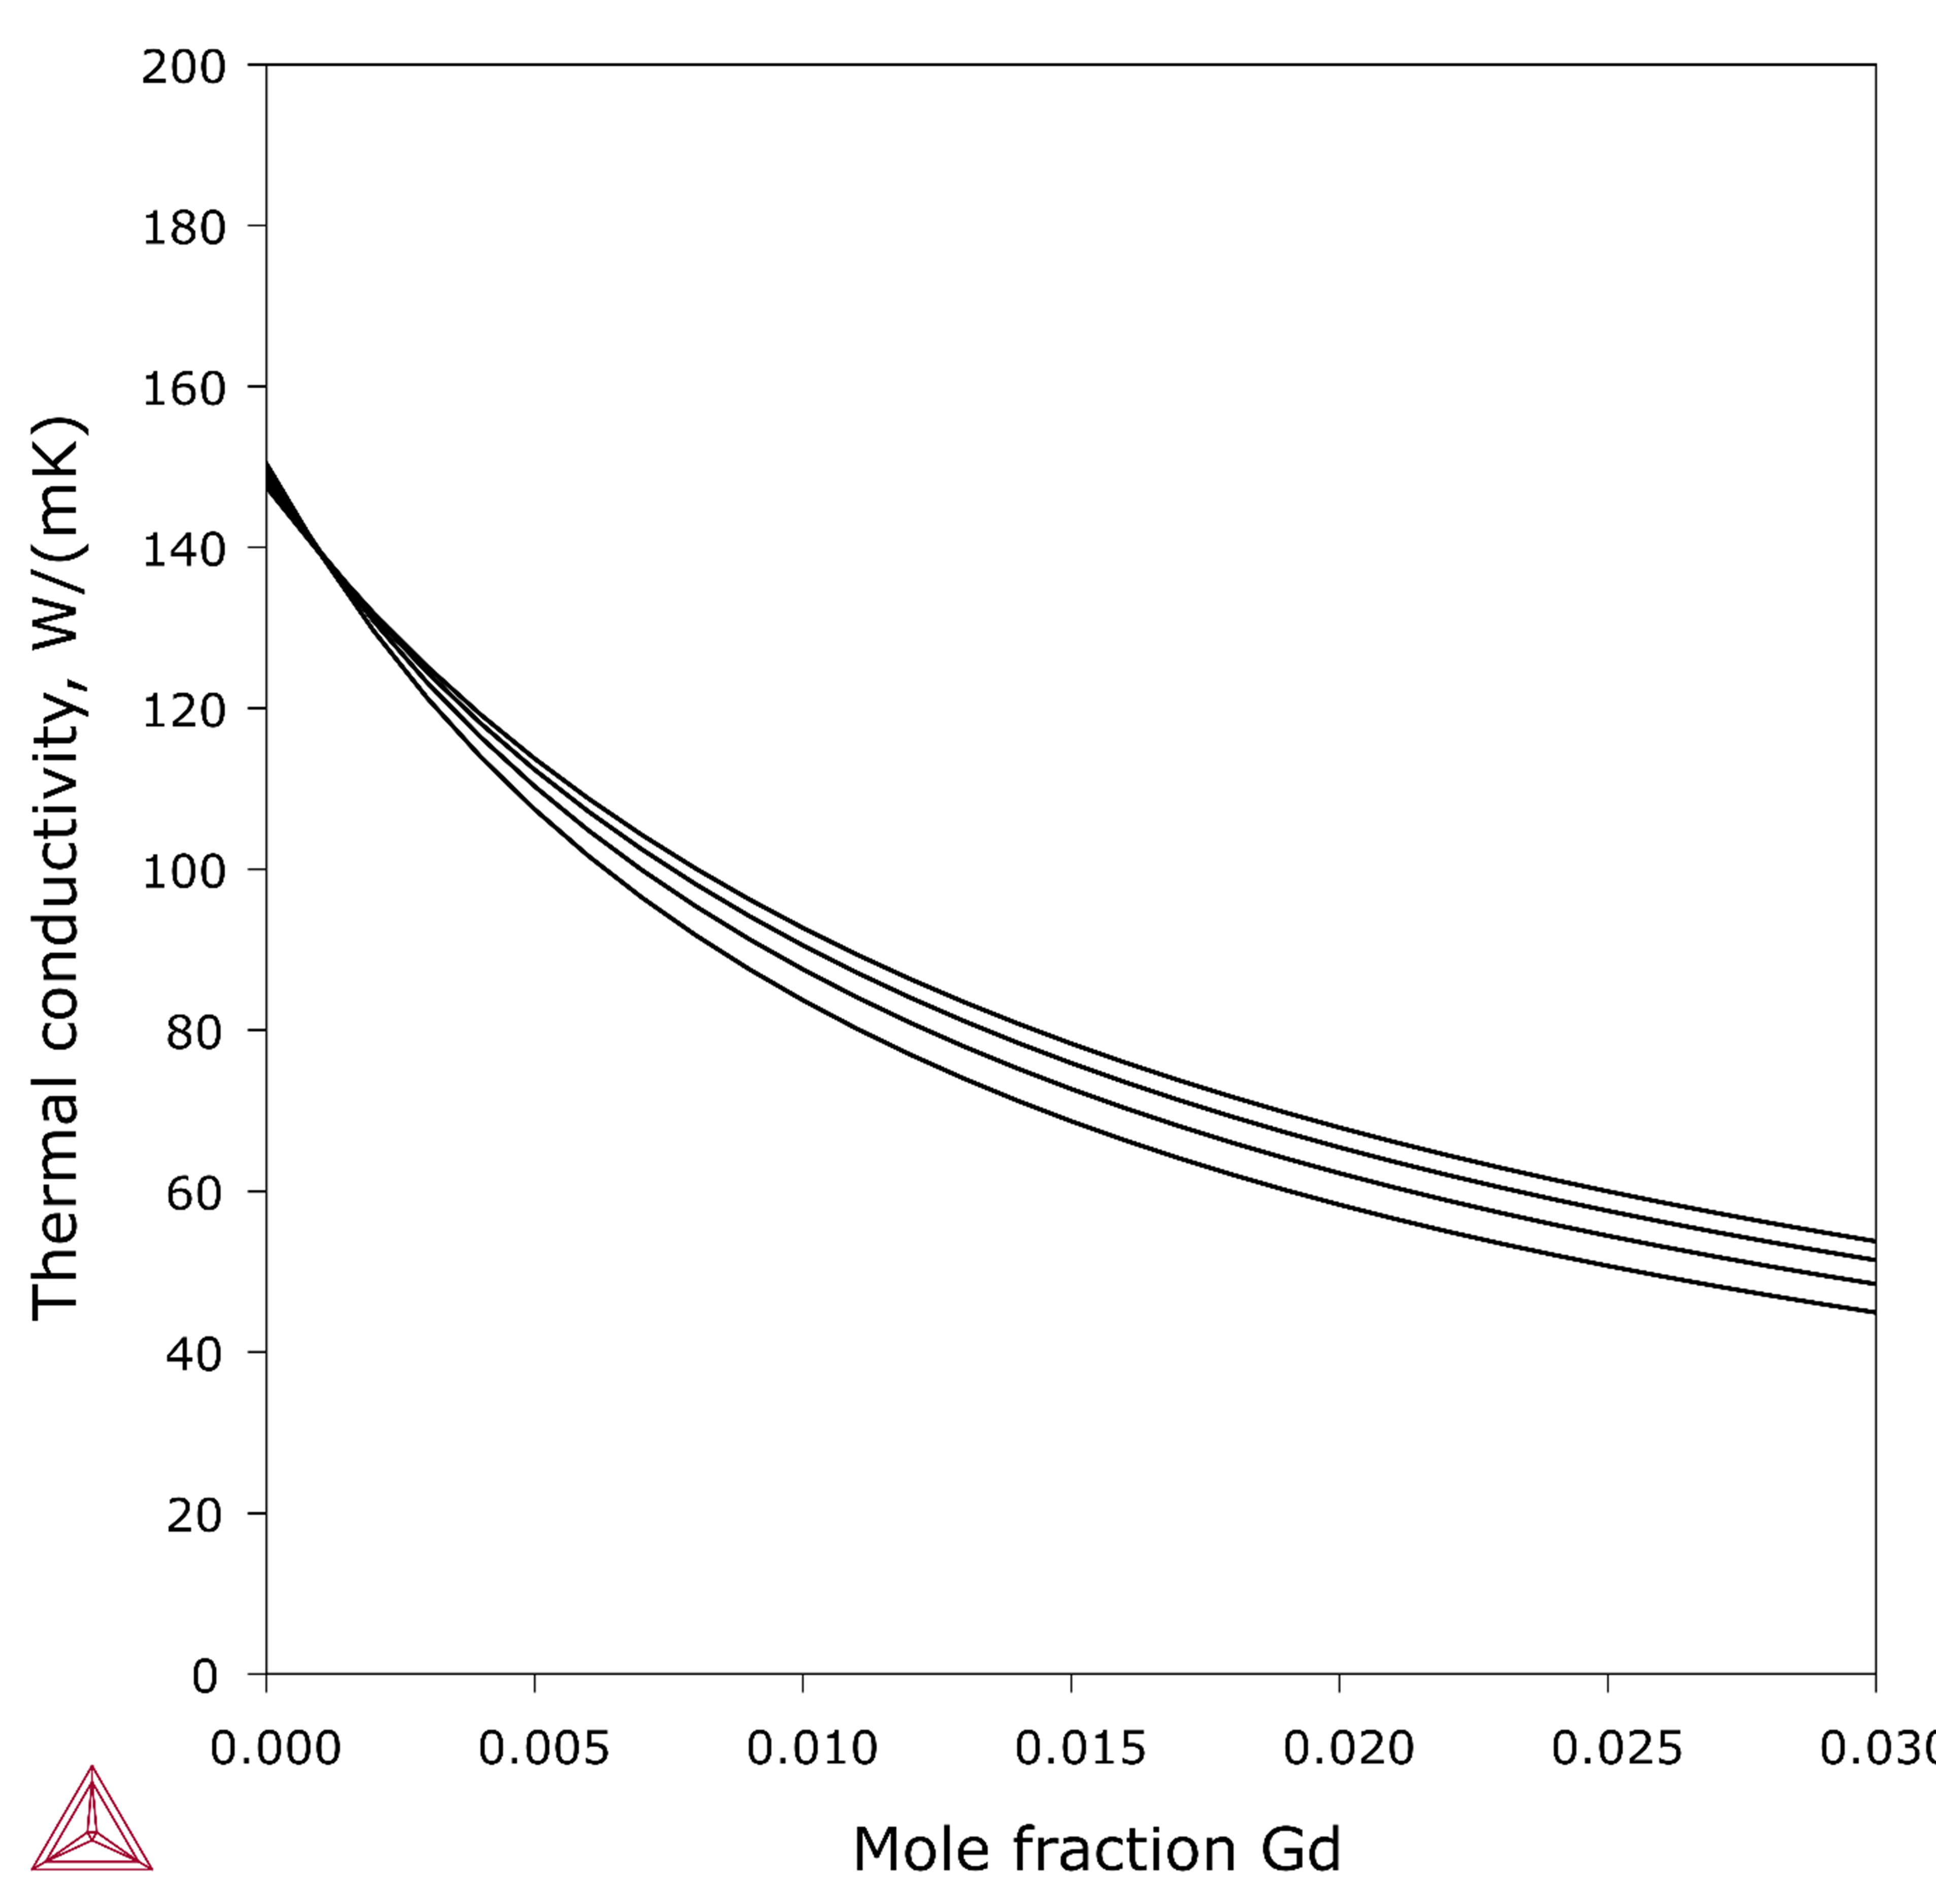
Figure 2 re-plots the thermal conductivity of (Mg) solid solution versus the composition of Gd, based on the recent experimental investigation by Huang [2019Hua] as well as considering results from Zhong et al. [2017Zho].
Figure 2: Calculated thermal conductivity of HCP_A3 solution in the Mg-Gd system, versus the Gd content.
Mg-Y
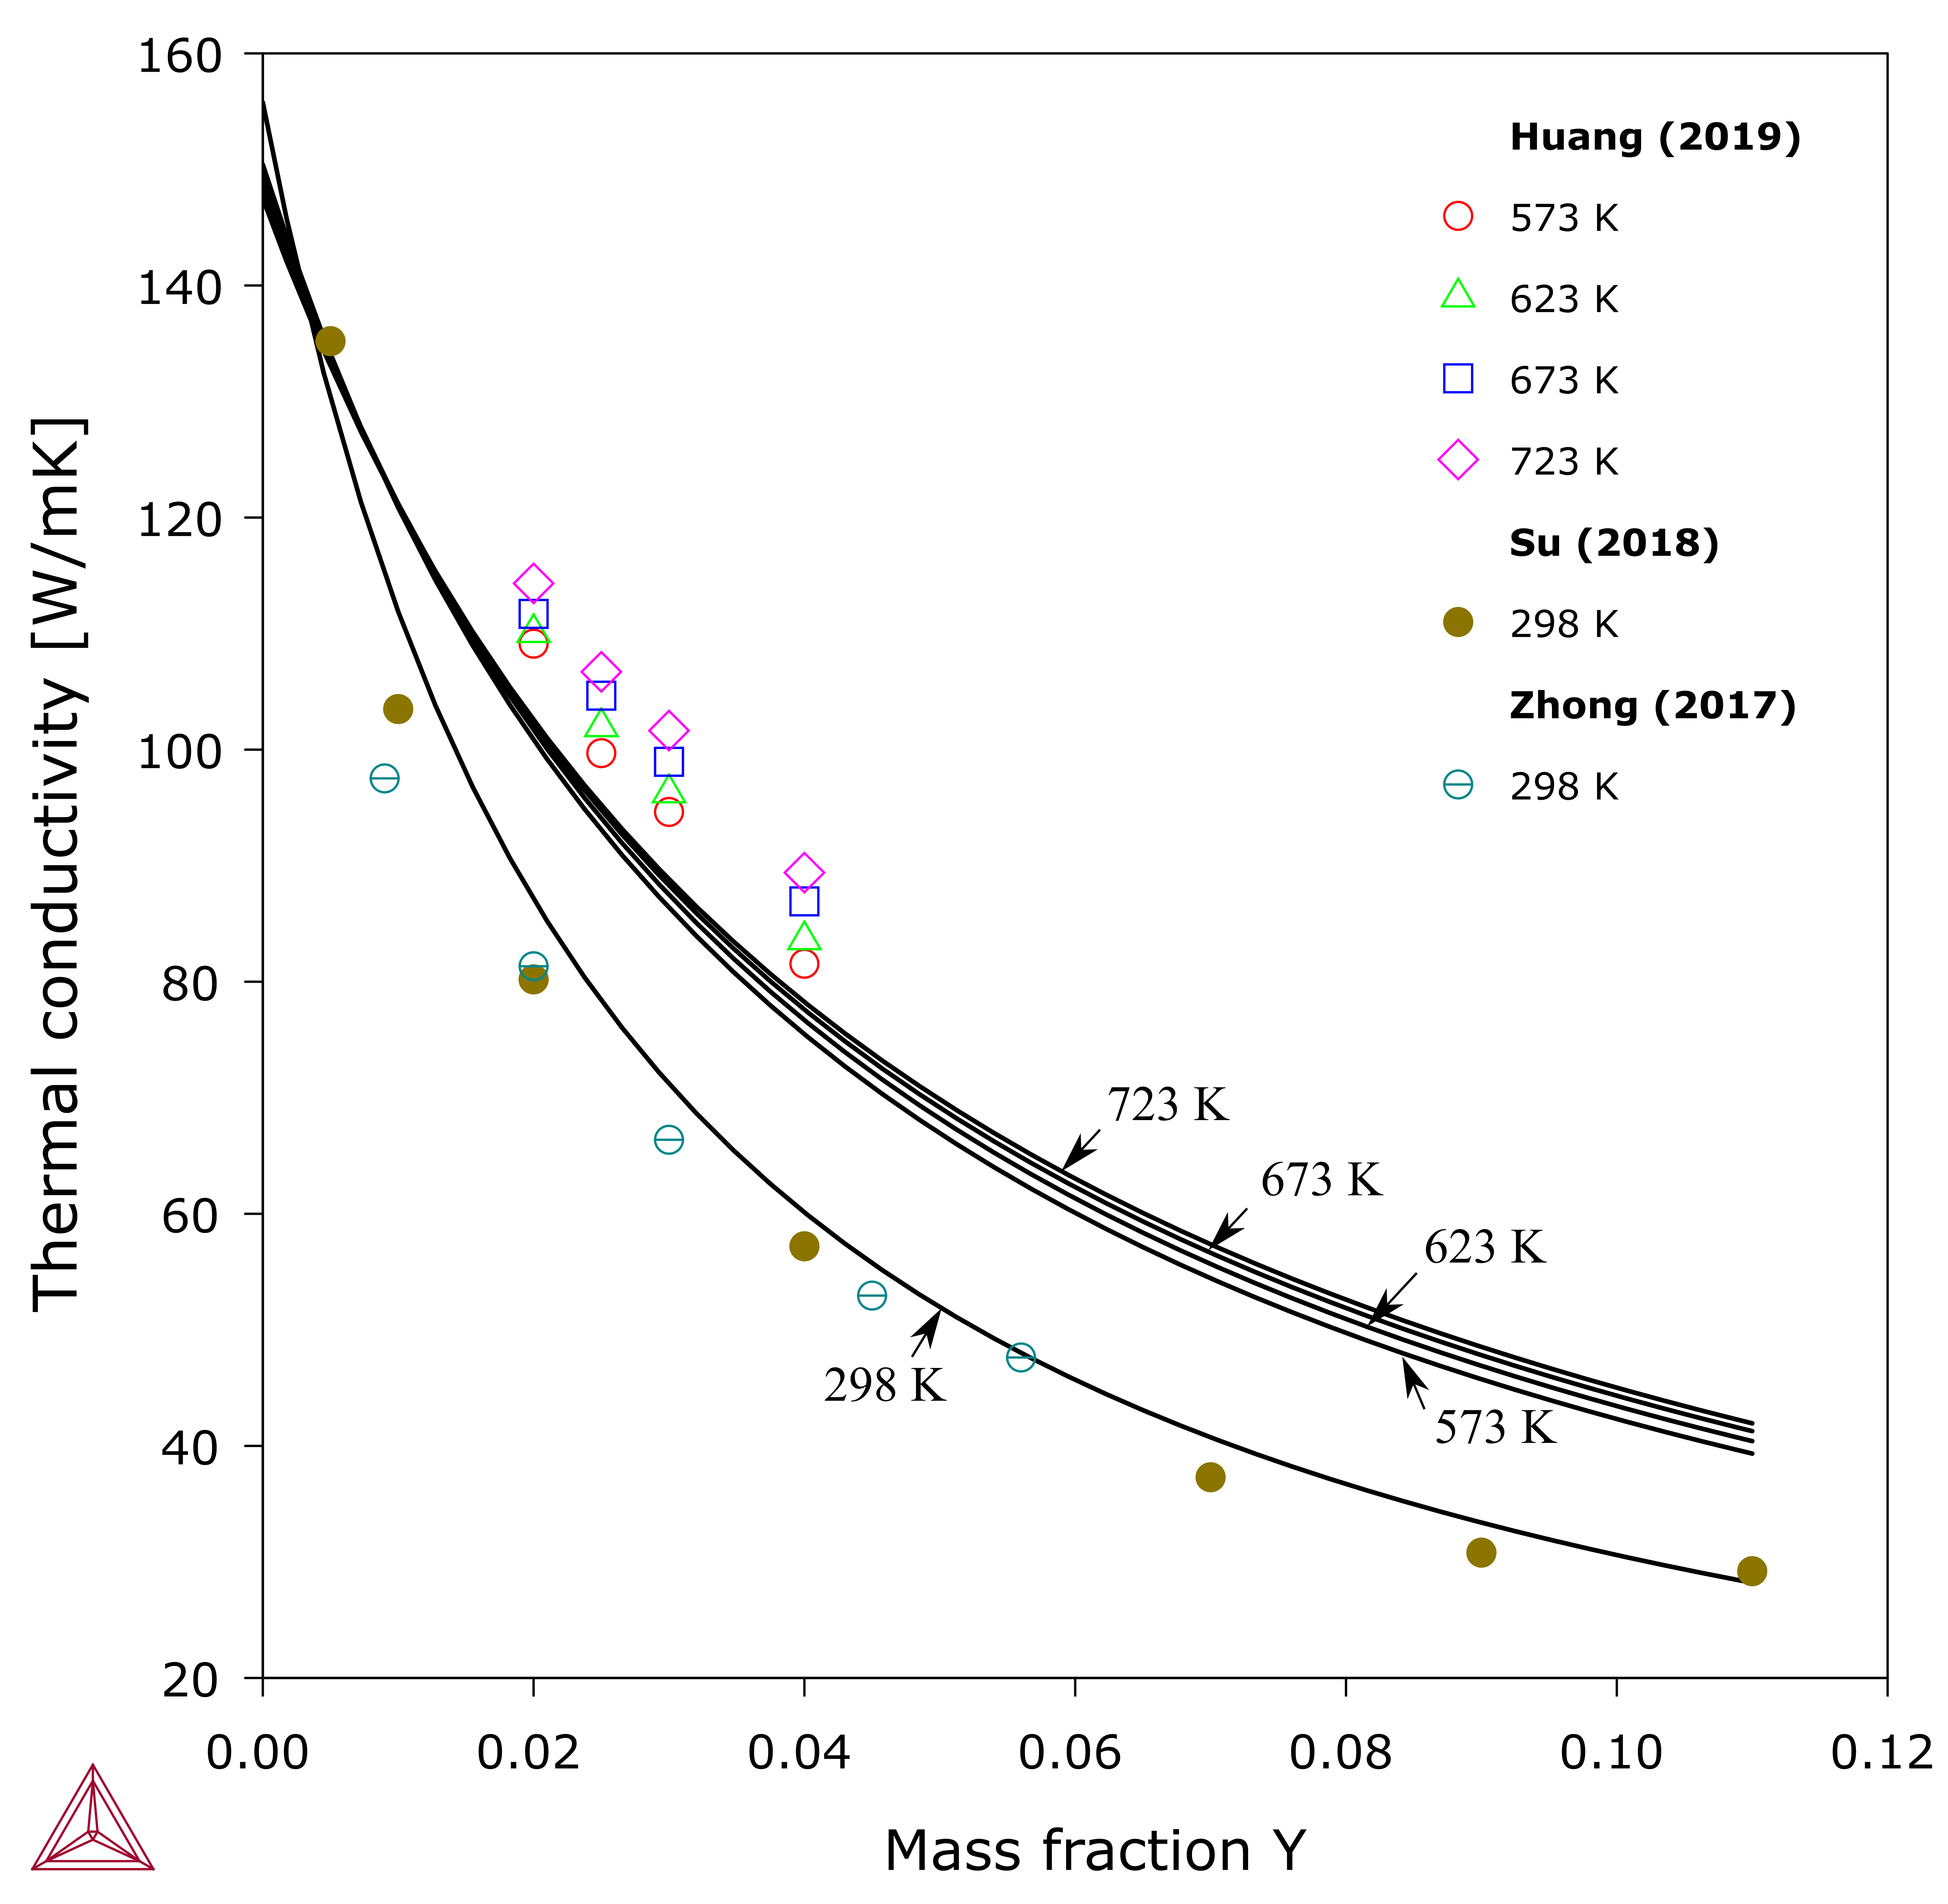
Zhong et al. [2017Zho], Huang [2019Hua], and Su et al. [2018Su] recently measured thermal conductivity of Mg-Y solution with heat-treated alloys. The heat treatments were performed, respectively, at 525 °C for 12 h, 400 °C for 30 days, and at 530 °C for 12 h. The two datasets by Zhong [2017] and Su [2018] generally agree with each other, but the former does not reasonably extrapolate to pure Mg, as shown in Figure 3. Interestingly, the datasets from Huang [2019] and Su et al. [2018] both extrapolate reasonably to pure Mg, although they differ noticeably from each other. The current description was derived mainly with the data from [2018Su] but with a compromise on a slightly better fitting to the data by [2019Hua].
Mg-Gd-Y
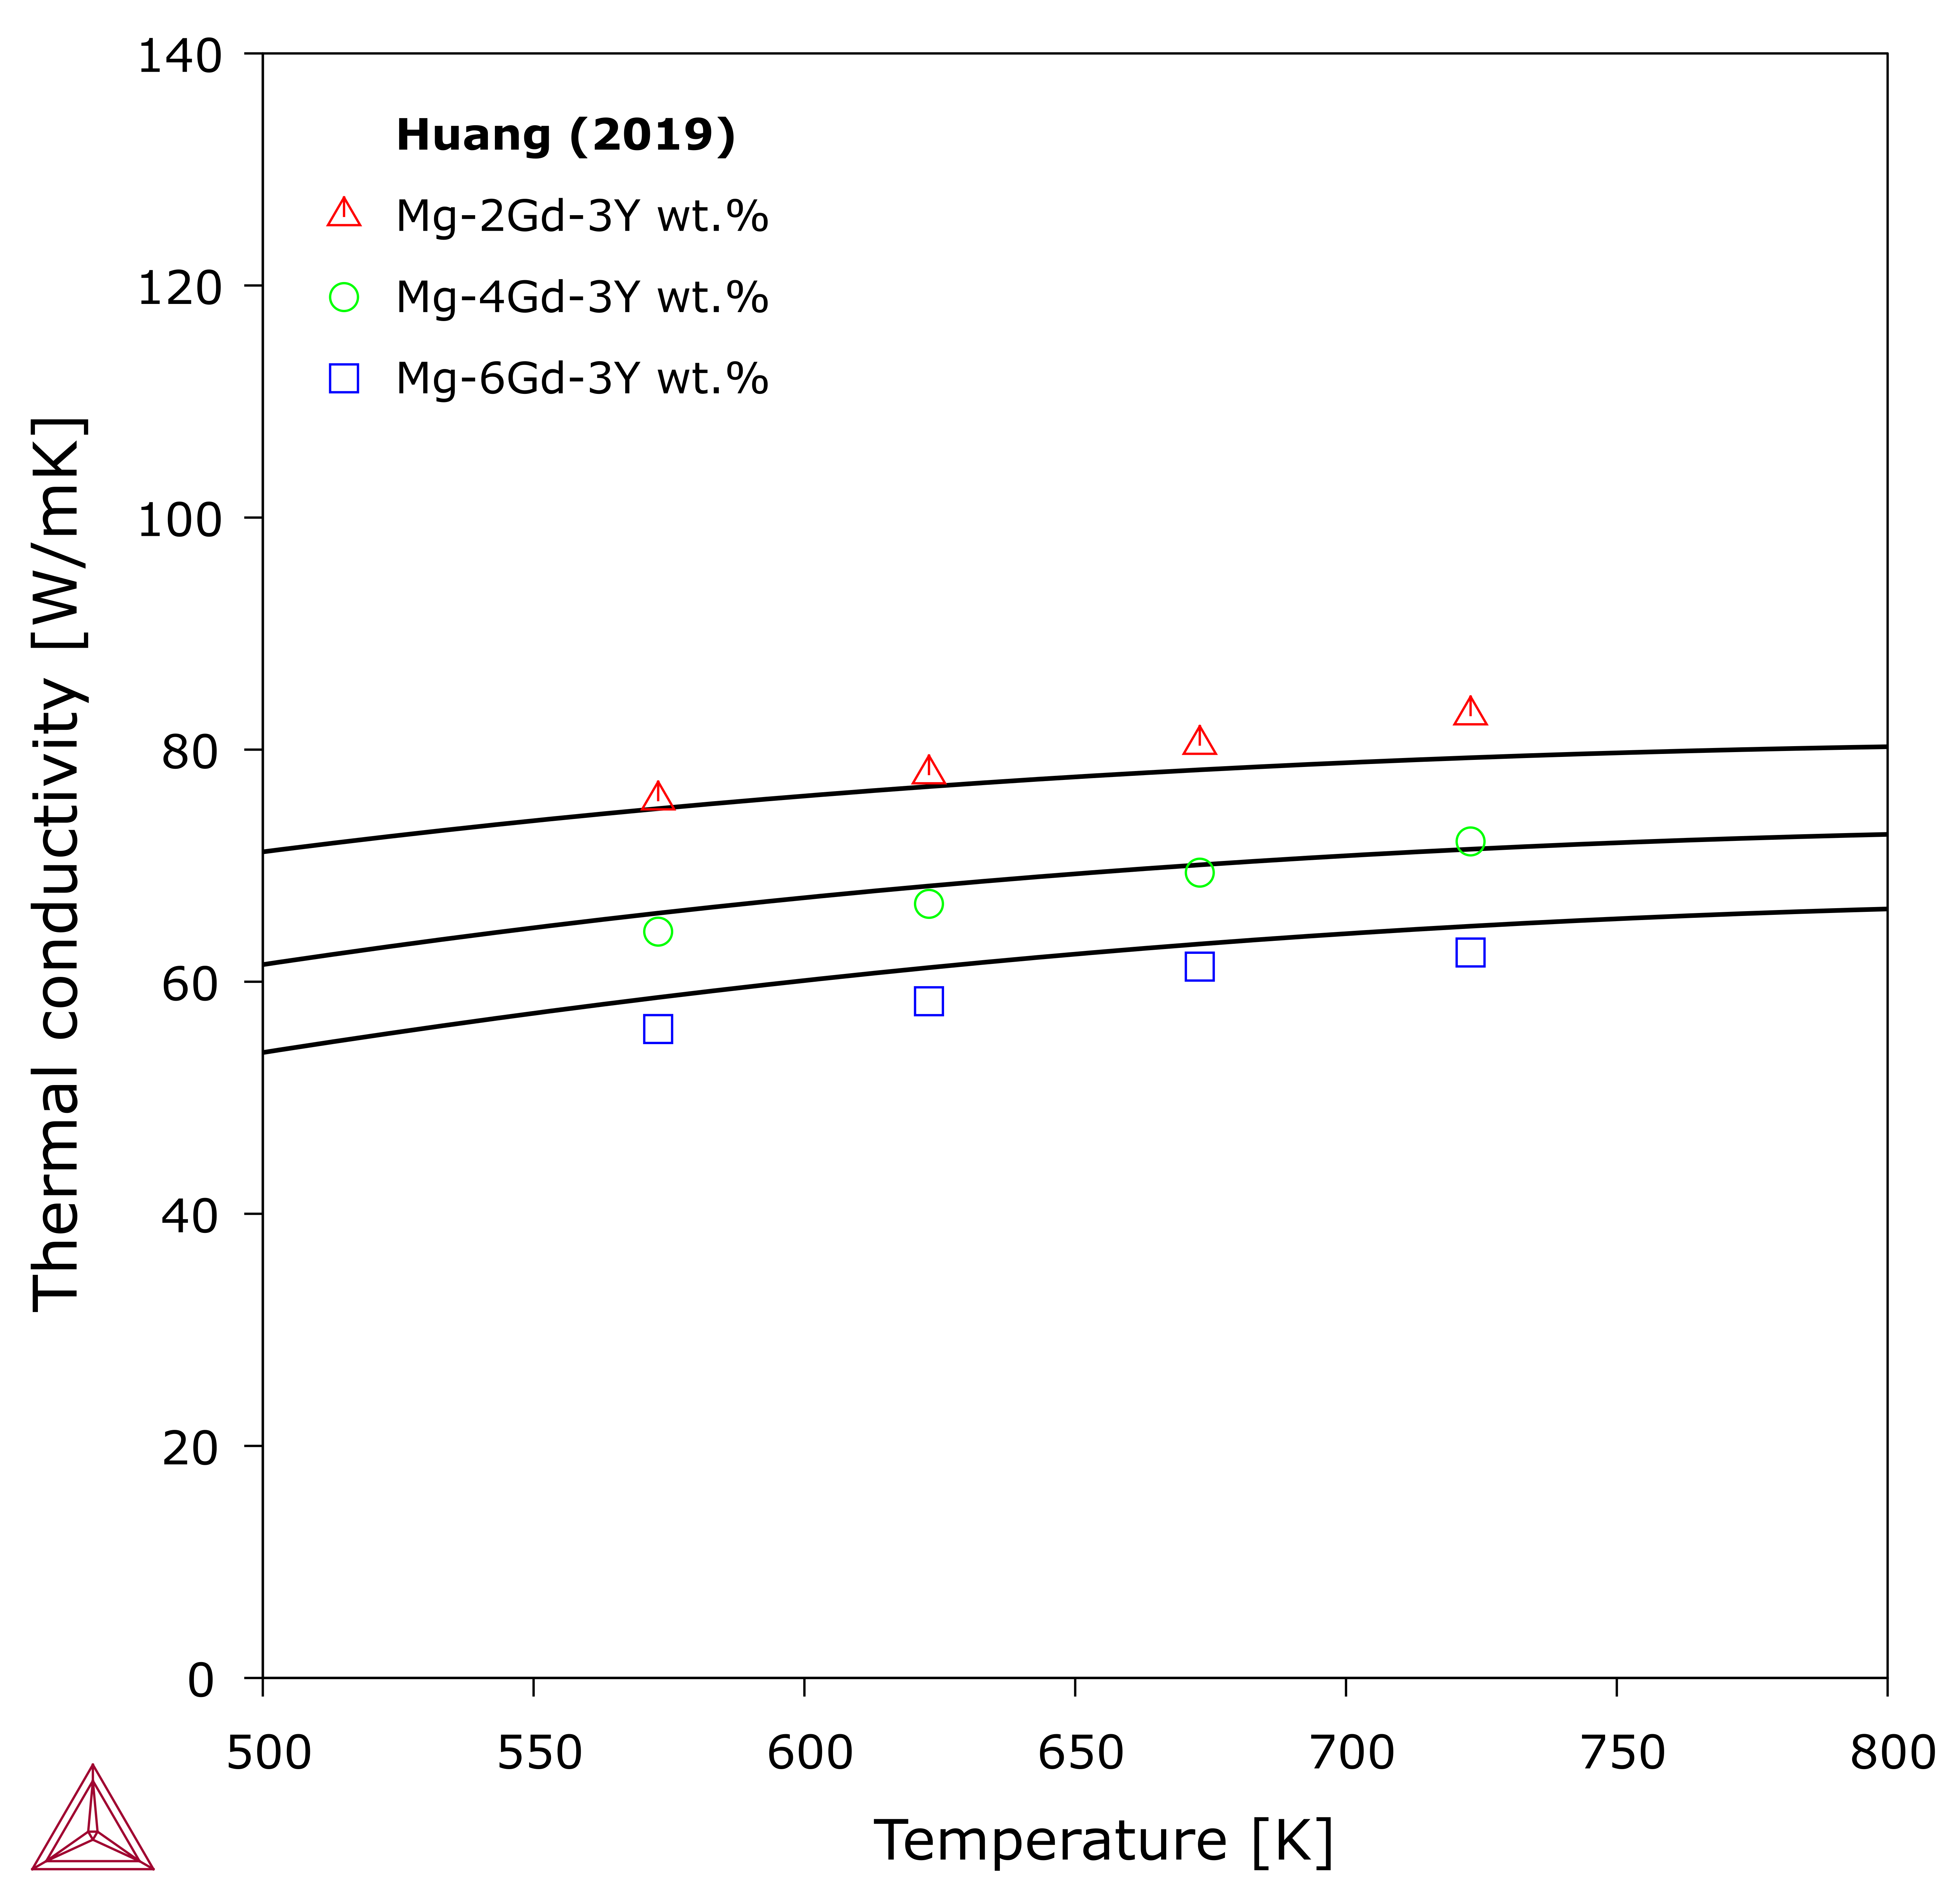
With the Gd-Mg and Mg-Y descriptions, the thermal conductivity of Mg-Gd-Y HCP_A3 solid solution can be reasonably extrapolated. As shown in Figure 4, the calculations well agree with the data by Huang [2019]. It is worth noting that no ternary interaction is used to avoid overfitting. The agreement with the ternary data also indicates that the binary Mg-Y data by Huang [2019] might be overestimated.
Zhong et al. [2017Zho] also reported thermal conductivity data from as-cast alloys. There are two aspects that need to be considered:
- The extra phases that form in the alloys in additional to the HCP_A3 (Mg) solid solution.
- The compositions segregation, especially in the (Mg) solution.
In order to account for such data, the calculations are done based on a series of Scheil simulations on various alloy compositions. From each simulation, the volume fraction of each layer of solid that forms at each (temperature) step of the solidification simulation is evaluated. Also evaluated is the thermal conductivity of each layer at the measuring temperature (room temperature in this case) according to the freeze-in concept. Then we sum up the quantities of all layers according to the volume fractions to predict the quantity for the whole as-cast alloy at the measuring temperature. This routine is repeated for a series of composition to get the curve shown in the plot.
Figure 5: Predicted thermal conductivity compared to as-cast experimental data from [2017Zho]. This plot is created using a custom TC-Python script, based on a series of Scheil simulations with TC-Python.
References
[2017Zho] L. Zhong, J. Peng, S. Sun, Y. Wang, Y. Lu, F. Pan, Microstructure and Thermal Conductivity of As-Cast and As-Solutionized Mg–Rare Earth Binary Alloys. J. Mater. Sci. Technol. 33, 1240–1248 (2017).
[2018Su] C. Su, D. Li, A. A. Luo, T. Ying, X. Zeng, Effect of solute atoms and second phases on the thermal conductivity of Mg-RE alloys: A quantitative study. J. Alloys Compd. 747, 431–437 (2018).
[2019Hua] L. Huang, Experimental measurement and computational simulation of thermal conductivity of Mg-Al-Zn and Mg-Gd-Y system, Central South University, Master's thesis (2019).


![Predicted thermal conductivity compared to as-cast experimental data from [2017Zho]. This plot is created using a custom TC-Python script, based on a series of Scheil simulations with TC-Python. Predicted thermal conductivity compared to as-cast experimental data from [2017Zho]. This plot is created using a custom TC-Python script, based on a series of Scheil simulations with TC-Python.](../../../resources/images/tcmg/gd-mg_thcd_as-cast_slice_smooth1.png)