Thermal Conductivity of Titanium Alloys
In the field of additive manufacturing, there are many researchers investigating titanium alloys. During the design and simulation process, it is important to have the necessary thermal conductivity data for a wide spectrum of compositions.
Using Thermo‑Calc with the TCS Ti/TiAl-based Alloys Database (TCTI), you can calculate the quantities of a phase φ with the variable THCD (φ), or a system (i.e. alloy) with THCD. You can also calculate the derived quantities, i.e. thermal resistivity (THRS) and thermal diffusivity (THDF), in a similar way.
The database includes thermal conductivity starting with version 4 (TCTI4).
TiAl Intermetallic Compound
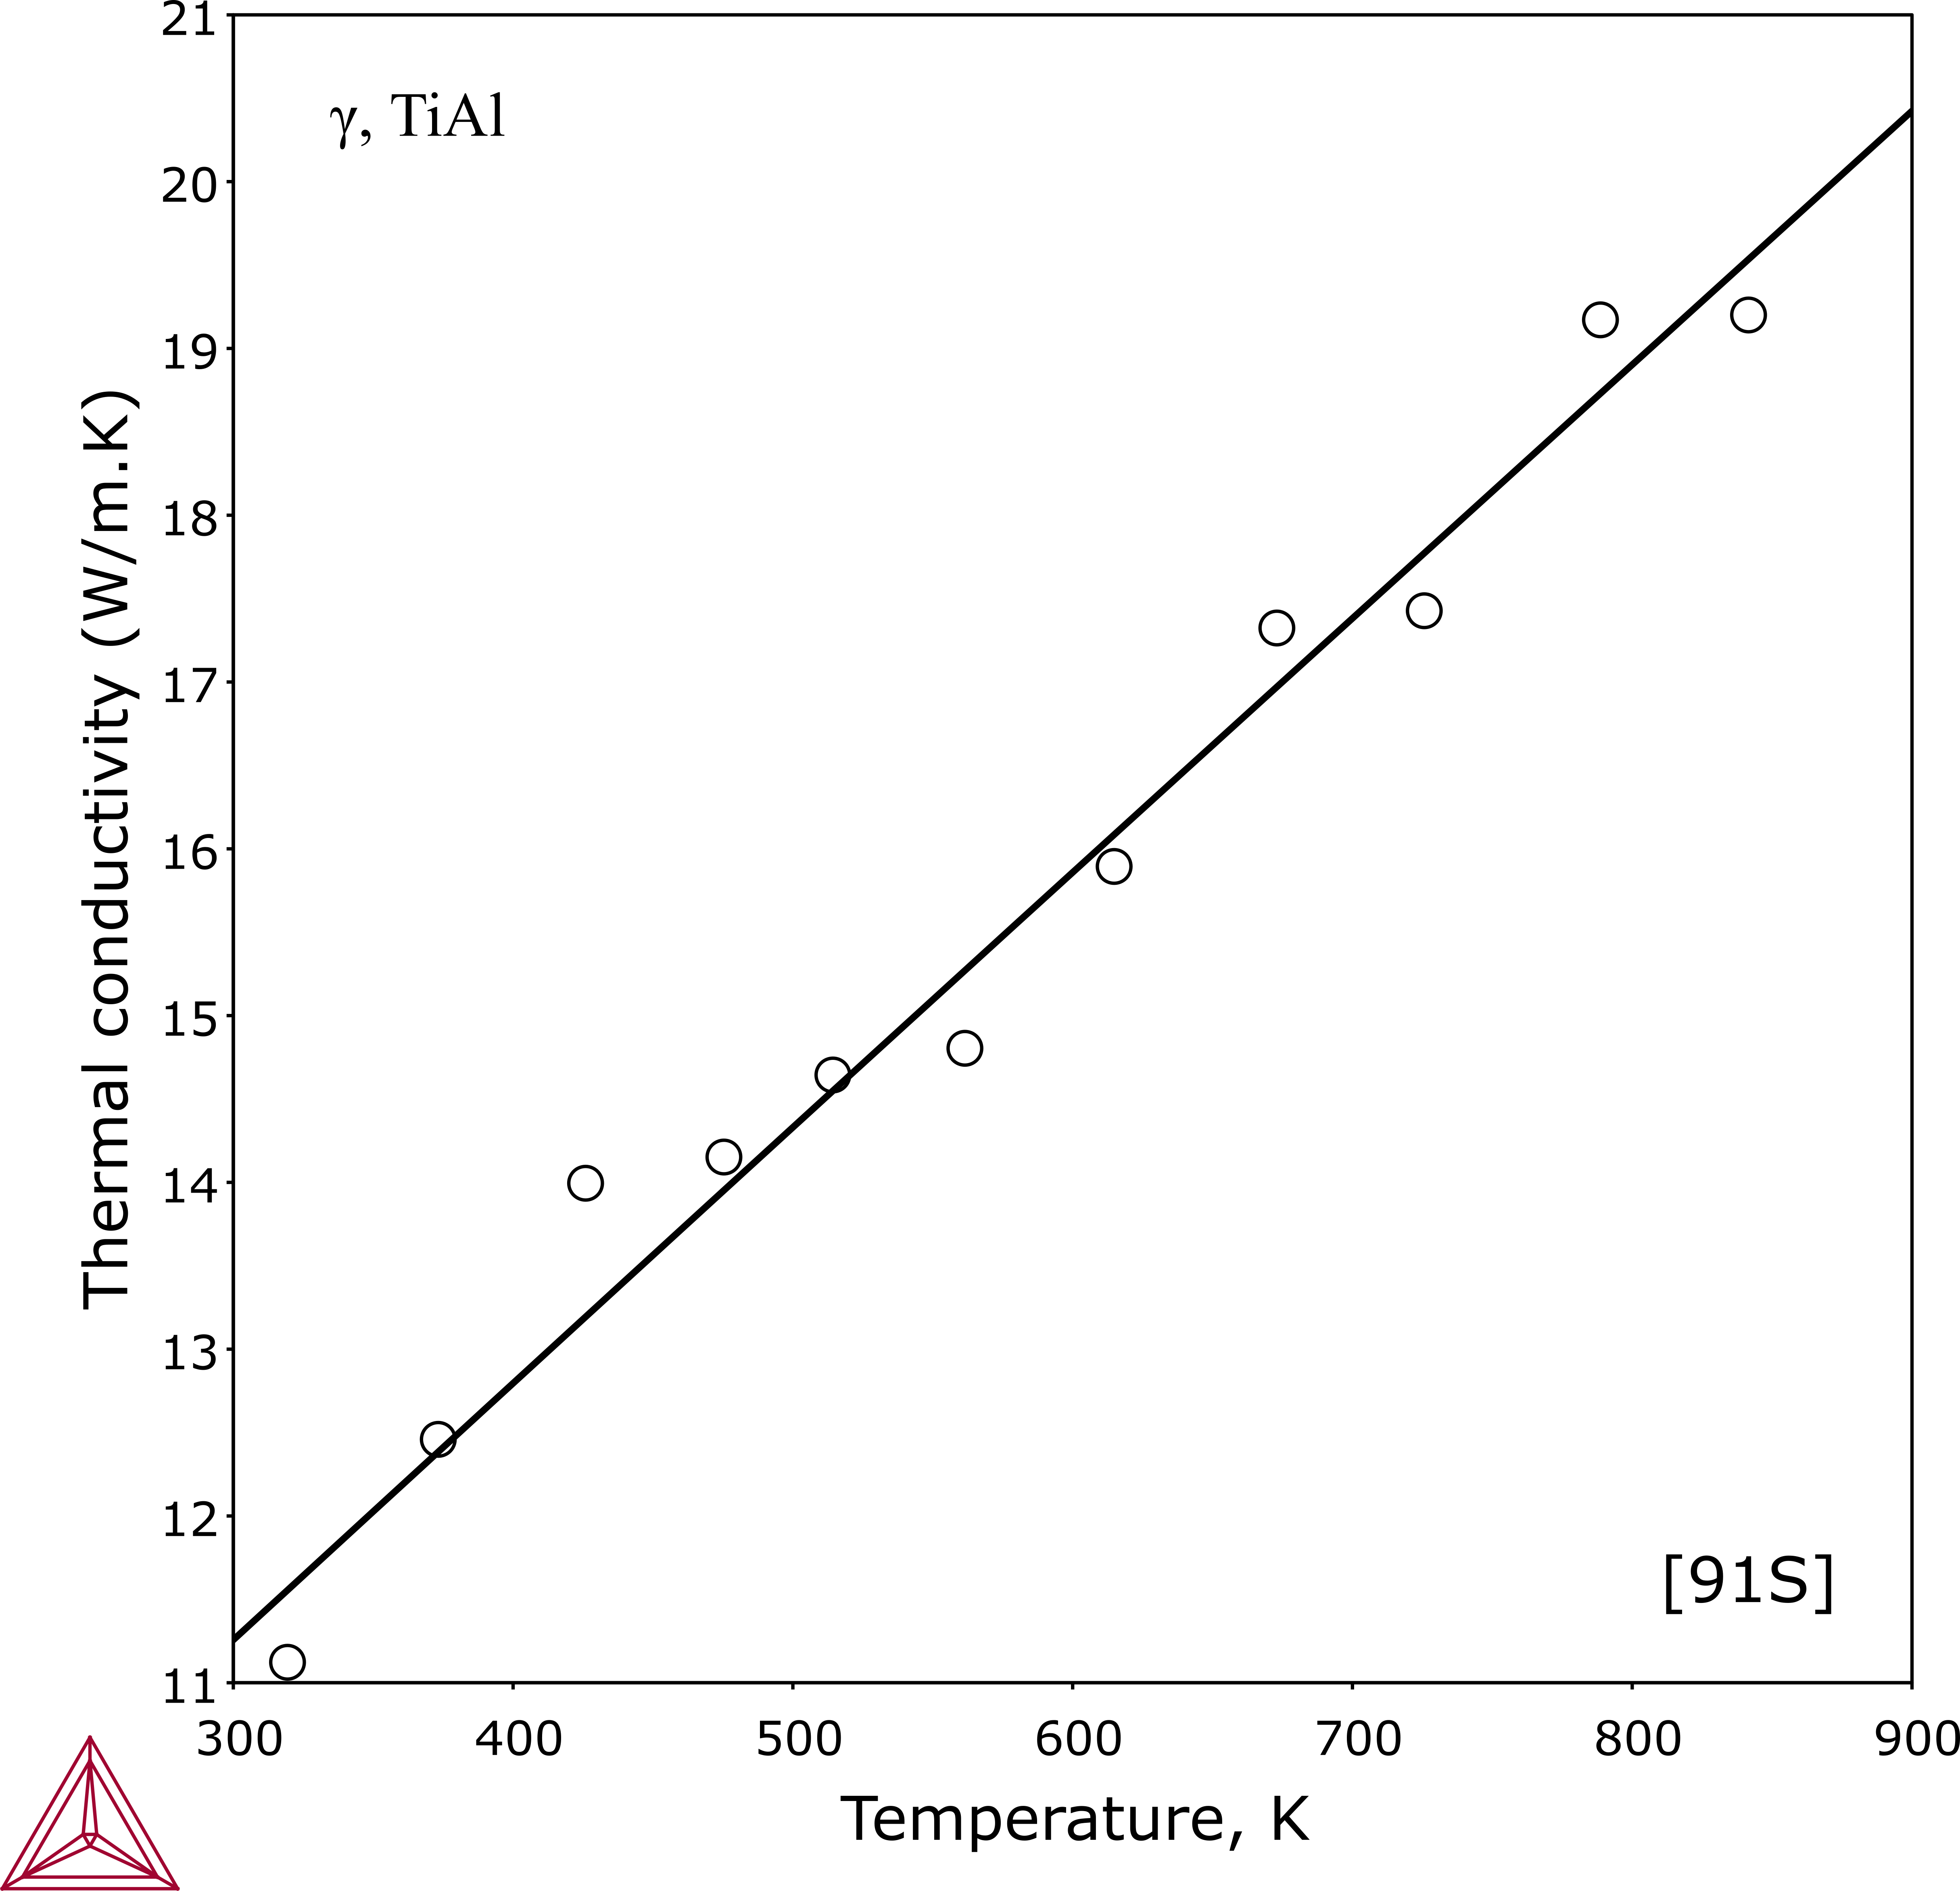
The γ phase is a key constituent phase for TiAl-based alloys. The plot shows calculated thermal conductivity for a TiAl intermetallic compound, which gives confidence on predictions of thermal conductivity for TiAl-based alloys when using the TCS Ti/TiAl-based Alloys Database (TCTI).
Variability in Experimental Data - An Example
During the modeling of both electrical resistivity and thermal conductivity for titanium alloys, a lot of time is spent assessing experimental data from the literature. This is critical in order to obtain reliable self-consistent descriptions of the given sub-systems, and then to be able to combine these systems and obtain predictions in multicomponent systems.
For measurements of transport properties such as electrical resistivity or thermal conductivity/diffusivity, the reported data for a single material may show significant scatter, which is generally also plagued with difficulties and measurement uncertainties.
Electrical Resistivity and Conductivity of Titanium Alloys
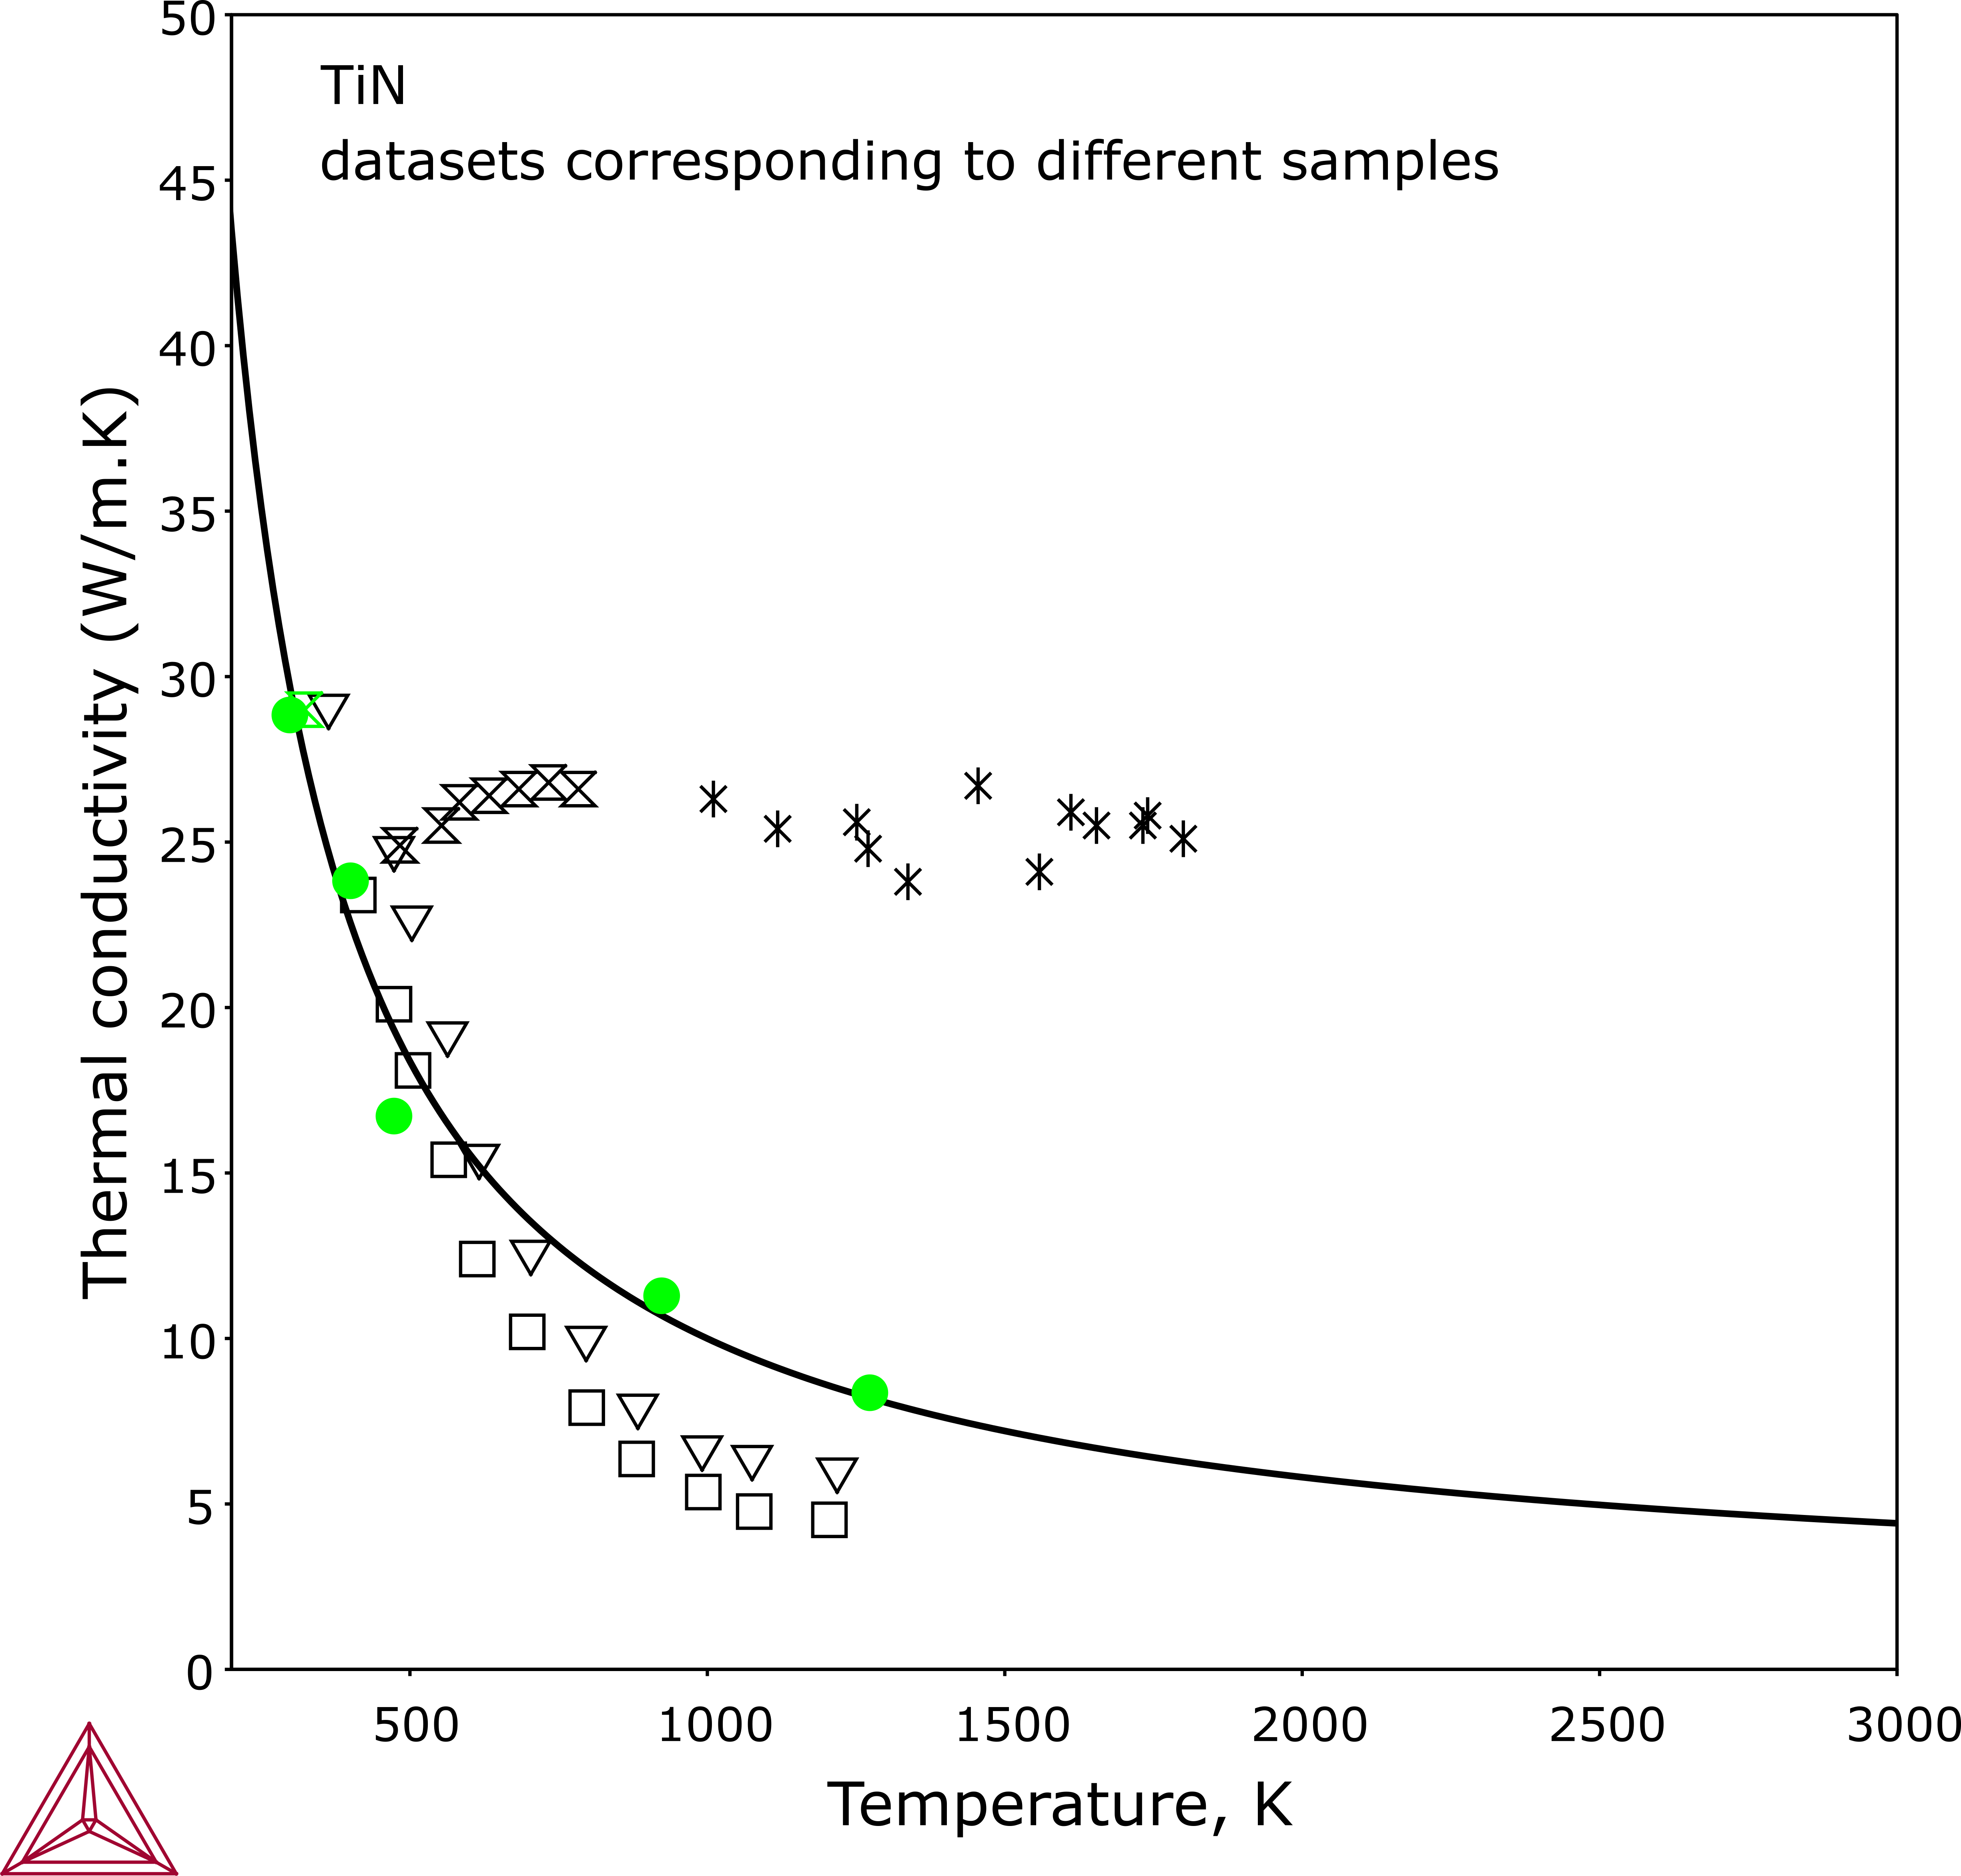
Common variability in the experimental data arises mainly from uncertainty of composition, unknown or ambiguous thermal history during manufacture, impurities, and so forth. This example shows some of this data scattering from the literature. A negative temperature dependence is revealed by three sets of data while the other two sets give almost constant thermal conductivity from ~500 to 2000 K.

