About the Crack Susceptibility Coefficient Property Model
The Crack Susceptibility Coefficient is a Property Model available when using the Property Model Calculator in Thermo‑Calc. It is used to calculate the hot tearing tendency during solidification. The model is based on the publication by Yan and Lin [2006Yan].
Hot tearing is one of the most common and serious defects encountered during the casting of, for example, aluminum alloys. In general, it is defined by the formation of a macroscopic fissure in a casting as a result of stress and the associated strain, generated during cooling, at a temperature above the non-equilibrium solidus.
Crack susceptibility is also referred to as solidification cracking, hot cracking, hot shortness, supersolidus cracking, and shrinkage brittleness [2006Yan].
The Crack Suscebility Coefficient (CSC) is calculated using Scheil results with three different models; Clyne and Davies [1981Cly; 2006Yan] , Kou [2015Kou], and Easton [2014Eas].
Input Parameters, Scheil Settings, and CSC Model Selection
There are these models to choose from as the Crack Susceptibility Coefficient (CSC) Model: Clyne and Davies, Kou, or Easton.
There are also several Scheil settings, including advanced options to choose from. Some additional theory and background is included below to supplement the settings input choices.
Clyne and Davis CSC Model Theory and Background
The original model assumptions are from Clyne and Davis [1981 Clyne]. Later, the experimental hot cracking susceptibility was collected from several sources by Yan and Lin [2006 Yan] and given as a probability 0-100%. The CSC calculated with the current model cannot be compared by absolute values with the experimental number; instead it is best to compare the trends, to see if it is increasing or decreasing. The experimental values are therefore given with relative coordinates and do not map directly to the calculated plot axes.
The following information describes the background when Clyne and Davies is chosen as the CSC Model.
The Crack Susceptibility Coefficient (CSC) was originally proposed by Clyne and Davies [1981Cly] to describe the effects of alloy composition on hot tearing.
The current model is based on the publication by Yan and Lin [2006Yan]. In Thermo‑Calc, the CSC is calculated using Scheil and uses assumptions of cooling rates under the thermal conditions that the heat flow is proportional to  .
.
The CSC is defined as  where:
-
 is the time during solidification where the casting is vulnerable to cracking, and
 -
 is the time available for the stress relief process.
The values for  and
and  are given by the thermal condition, the Scheil results, and the input parameters for the liquid fraction (defined on the Configuration window):
- Start of relaxation
- Transition to vulnerability
- Smallest for vulnerability
These liquid fraction parameters are elaborated on next using the results from a simulation using the TCS Al‑based Alloy Database (TCAL) and the alloy Al-0.9Cu-10Mg-0.9Ni-12.2Si mass%.
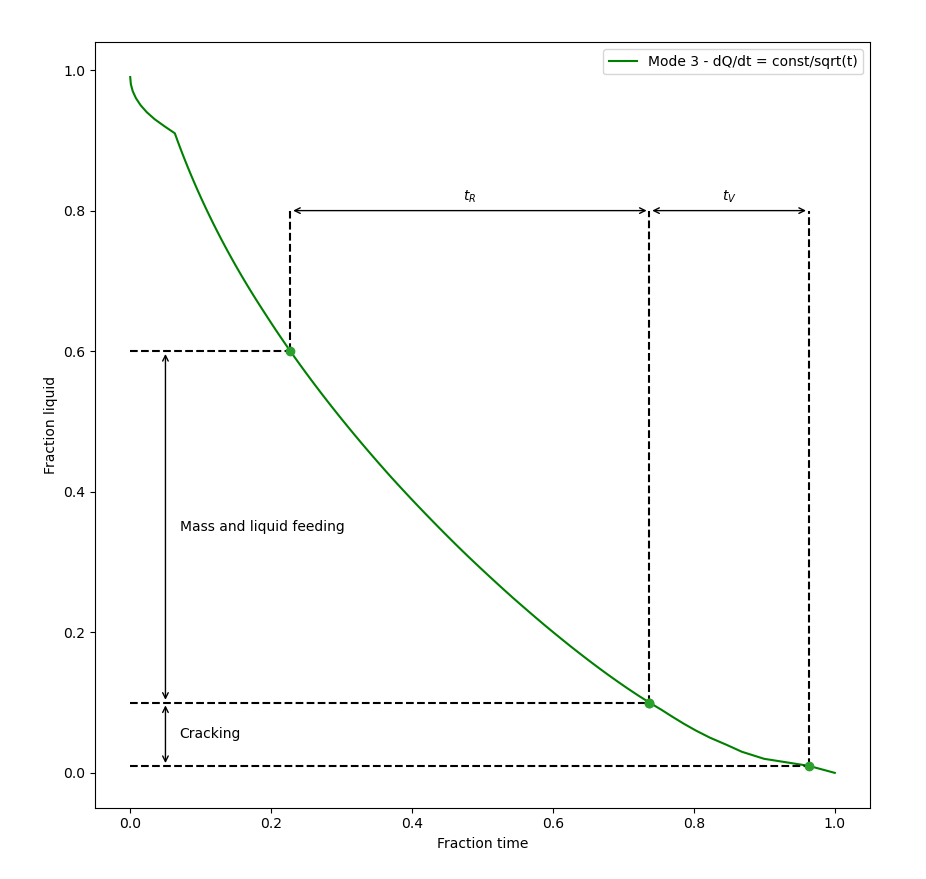
Figure 1: The results of the thermal condition in Mode 3, fraction of liquid, including the addition of lines and arrows to the plot for clarity. See the text for more detail.
Liquid Fraction Parameters
The Crack Susceptibility Coefficient Model is based on the concept of the existence of critical time periods during the solidification process when the structure is most vulnerable to cracking.
Clyne and Davies concluded that the mass and liquid feeding readily occurs at liquid volume fractions between about 0.6 and 0.1, so the time spent in these ranges was defined as time-relaxation ( ). At very low volume fractions of liquid, the material is too strong to crack. The authors chose a fraction of liquid between 0.1 and 0.01 as the vulnerable regime, and the time spent defined as
  . See Figure 1 for the results from a simulation using the TCS Al‑based Alloy Database (TCAL) and the alloy Al-0.9Cu-10Mg-0.9Ni-12.2Si mass%.
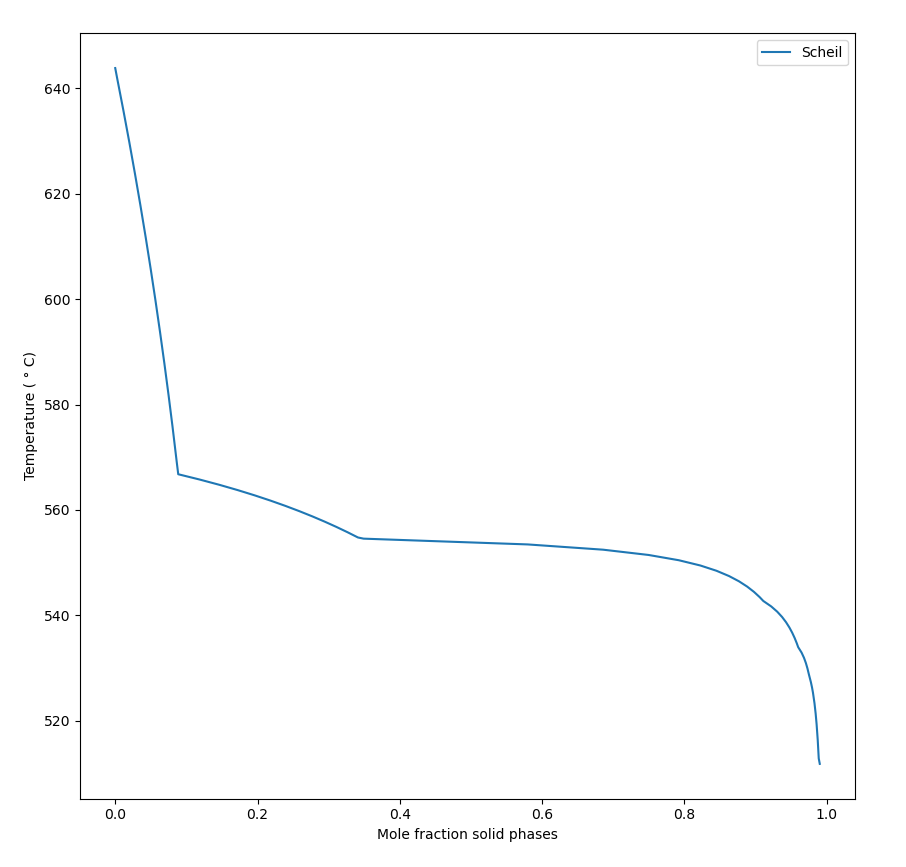
The Scheil simulation takes temperature steps and does not regard time at all. See Figure 2 for the typical Scheil results of amount of solid phases as function of temperature. The simulation is made with the TCS Al‑based Alloy Database (TCAL) and the alloy Al-0.9Cu-10Mg-0.9Ni-12.2Si mass%.
A thermal condition is assumed to connect the amount of liquid fraction to fraction of time.
Figure 2: A Scheil simulation result of the mole fraction solid phases vs temperature (°C). See the text for more detail.
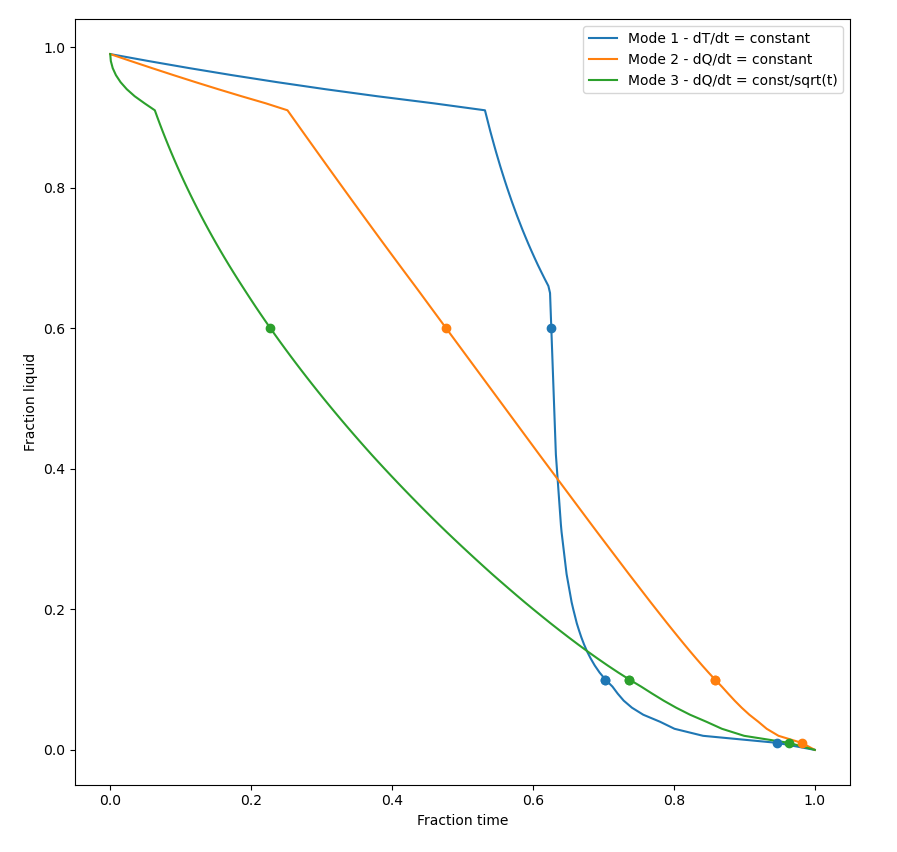
Following Clyne and Davies’ approach, the cooling rates were then estimated under three different thermal conditions:
- Mode 1 with a constant cooling rate, dT/dt = constant
- Mode 2 with a constant heat flow, , dQ/dt = constant, and
- Mode 3 with a heat flow proportional to 1/sqrt(time)
Then:
- Liquid fraction: Start of relaxation
- Liquid fraction: Transition to vulnerability
- Liquid fraction: Smallest for vulnerability
The crack index can then be obtained from the Scheil simulation results: fraction liquid vs T curve and the thermal condition.
1-fraction solid phases = fraction liquid phase.
Figure 3 can be thought of as the 'master curve' for the connection between fraction of liquid and fraction of time. The limits of the amount of liquid 0.01, 0.1, and 0.6 and the corresponding fraction time are shown for each thermal condition. In Figure 1 , which is a less cluttered plot, the time spent in the relaxation and in the vulnerable regions are marked with lines and arrows for a single thermal mode.
Figure 3: The results of the thermal condition in Modes 1-3, the fraction of time vs the fraction of liquid. See the text for more detail.
Kou CSC Model
When Kou is chosen as the CSC Model [2015Kou], the cracking susceptibility coefficient is defined as the absolute value of the derivative of the  vs
vs  curve at the end of the solidification, where
-
 = Temperature
 -
 = fraction solid
Easton CSC Model
When Easton is chosen as the CSC Model [2014Eas], the cracking susceptibility coefficient is defined as the integral of  between
  and
and  where
where
-
 = fraction solid
 -
 = temperature for the solid fraction of a coherent dendrite structure.
 -
 = The temperature for the solid fraction of coalescence of dendrite structure. The user inputs are the solid fraction for coherency and coalescence.
The settings are entered on the Configuration window for the Property Model Calculator and described in Crack Susceptibility Coefficient Property Model Settings.
For an example, see PM_G_07: Hot Crack Susceptibility.
[1981Cly] T. W. Clyne, G. J. Davies, The Influence of Composition on Solidification Cracking Susceptibility in Binary Alloy Systems. Br. Foundrym. 74, 65–73 (1981).
[2006Yan] X. Yan, J. C. Lin, Prediction of hot tearing tendency for multicomponent aluminum alloys. Metall. Mater. Trans. B. 37, 913–918 (2006).
[2014Eas] M. A. Easton, M. A. Gibson, S. Zhu, T. B. Abbott, An A Priori Hot-Tearing Indicator Applied to Die-Cast Magnesium-Rare Earth Alloys. Metall. Mater. Trans. A. 45, 3586–3595 (2014).
[2015Kou] S. Kou, A criterion for cracking during solidification. Acta Mater. 88, 366–374 (2015).


