PM_G_07: Hot Crack Susceptibility
The example uses the Property Model Calculator and the Crack Susceptibility Coefficient Property Model to calculate the hot tearing tendency during solidification for an Al-Si alloy. The ALDEMO: Aluminum Demo Database is used and this example is available to all users.
Hot tearing is one of the most common and serious defects encountered during the casting of, for example, aluminum alloys. In general, it is defined by the formation of a macroscopic fissure in a casting as a result of stress and the associated strain, generated during cooling, at a temperature above the non-equilibrium solidus.
The Model is based on the publication by Yan and Lin [2006Yan] and uses experimental data [1955Pum; 1976Feu; 2004Bar] from this paper.
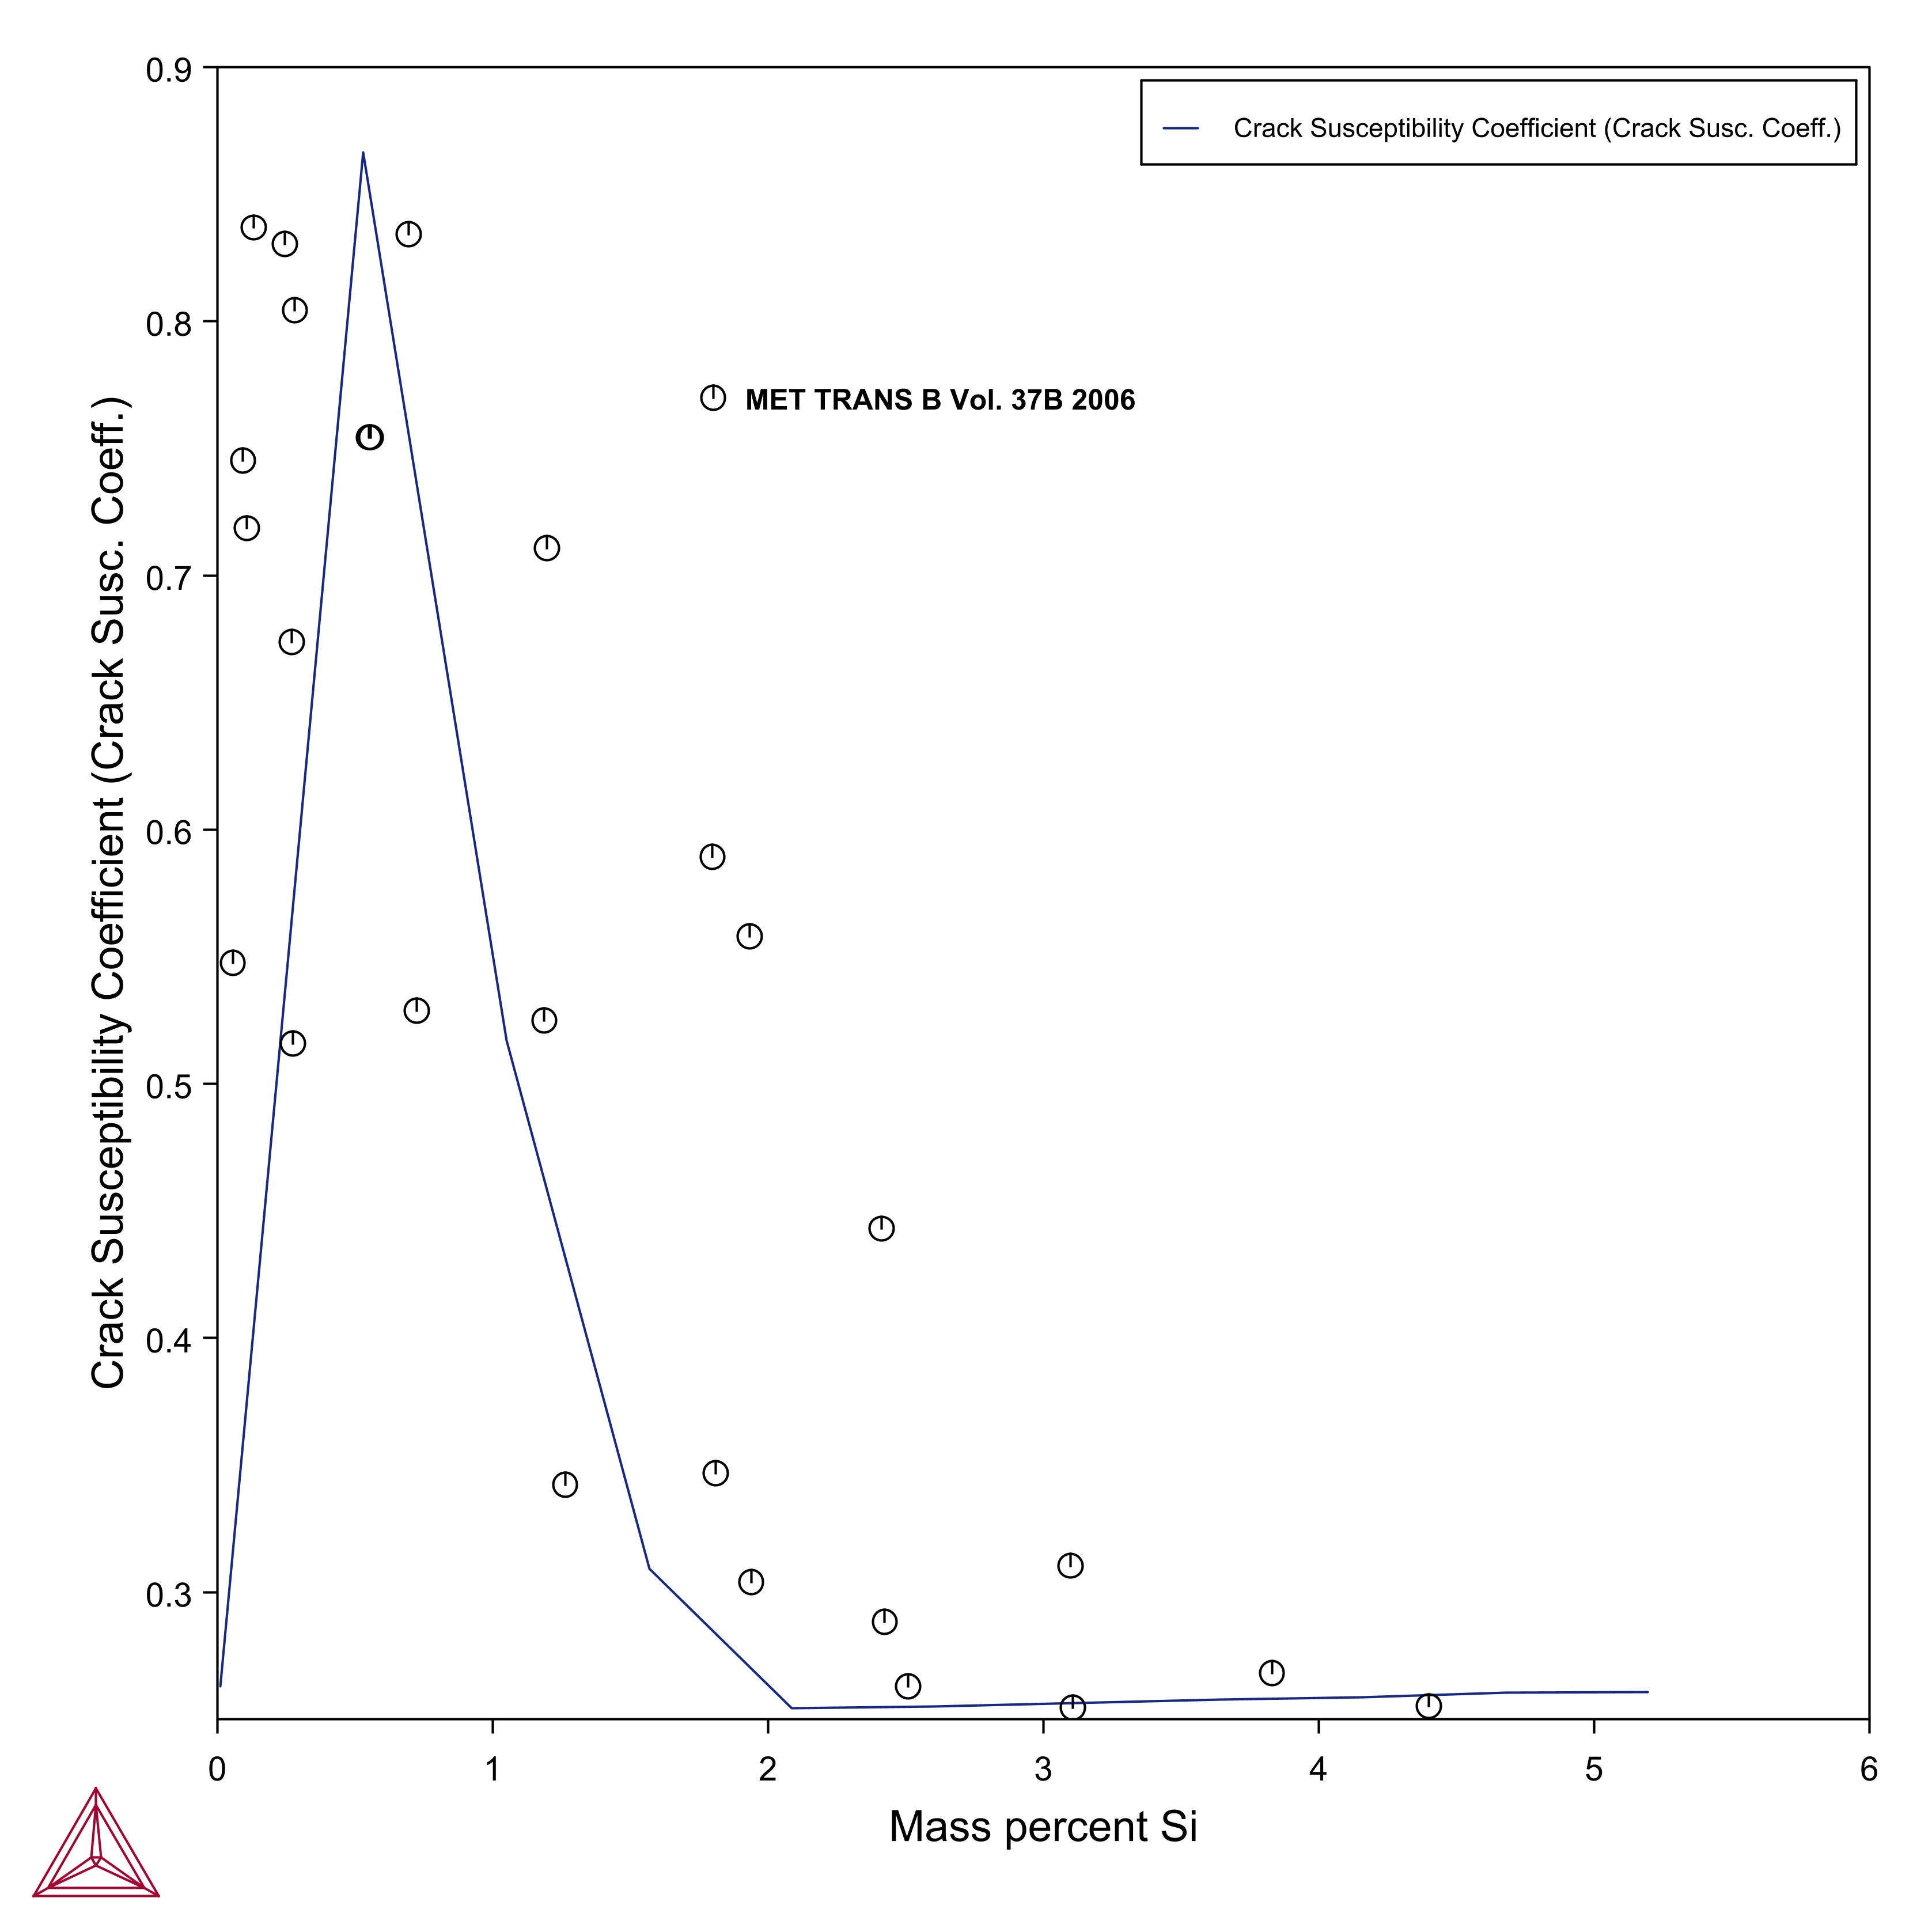
The experimental hot cracking susceptibility of an alloy is defined as the ratio between the cracking length for that alloy and the maximum cracking length in the alloy system studied. Considering the uncertainties and difficulties in hot tearing measurements, the calculated hot tearing tendencies are in excellent agreement with the experimental data. The typical L-shaped curve is well reproduced in the current prediction. It rapidly increases at a low solute content and has a maximum at a composition of around 0.5 wt pct Si.
See About the Crack Susceptibility Coefficient Property Model for background information about this Property Model.
- Folder: Property Models → General
- File name: PM_G_07_Hot_Crack_Susceptibility.tcu
Visualizations
This example is included as a Property Model tutorial on our website and as part of the Property Model Calculator playlist on our YouTube channel.
Open the example project file to review the node setup on the Project window and the associated settings on the Configuration window for each node. For some types of projects, you can also adjust settings on the Plot Renderer Configuration window to preview results before performing the simulation. Click Perform Tree to generate plots and tables to see the results on the Visualizations window.
Figure 1: The plot compares the predicted cracking susceptibility/composition curve for the Al-Si system with the experimental hot tearing tendencies [1955Pum; 1976Feu; 2004Bar].
References
[1955Pum] W.I. Pumphrey: ‘‘The Aluminum Development Association Report No. 27,’’ Aluminum Development Association, London, 1955.
[1976Feu] U. Feurer, Mathematical Model by the Hot Cracking Tendency of Binary Aluminum Alloys. Giessereiforschung. 28, 75–80 (1976).
[2004Bar] S. R. Barnett, J. A. Taylor, and D. H. St. John: Solidification of Aluminum Alloys, M.G. Chu, D.A. Granger, and Q. Han, eds., TMS, Warrendale, PA, 2004, pp. 201-09.
[2006Yan] X. Yan and J. C. Lin, “Prediction of hot tearing tendency for multicomponent aluminum alloys,” Metall. Mater. Trans. B, vol. 37, no. 6, pp. 913–918, Dec. 2006.
