Plotting Several Calculations in One Diagram
To plot several calculations in one diagram, you must have, in addition to the Plot Renderer’s original predecessor, at least one available Plot Renderer predecessor in your project, for example, the additional predecessor can be an Equilibrium Calculator, Binary Calculator, Ternary Calculator, Scheil Calculator, or Experimental File Reader.
This example is based on Thermo-Calc example T_05: Stable and the Metastable Fe-C Phase Diagrams.
- In the Project window click the Plot Renderer node.
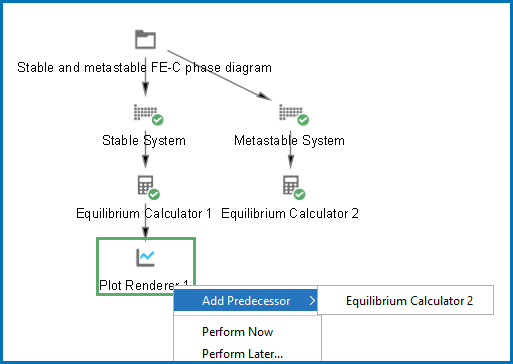
- In the Configuration window click Add Predecessor. Or right-click the Plot Renderer and choose Add Predecessor.
-
Select a predecessor. When added, the extra predecessor is linked to the Plot Renderer. On the Plot Renderer Configuration window, the predecessors are shown as two tabs:
-
Configure how you want each calculation plotted on the tabs in the Configuration window, then click to Perform the Plot Renderer activity.
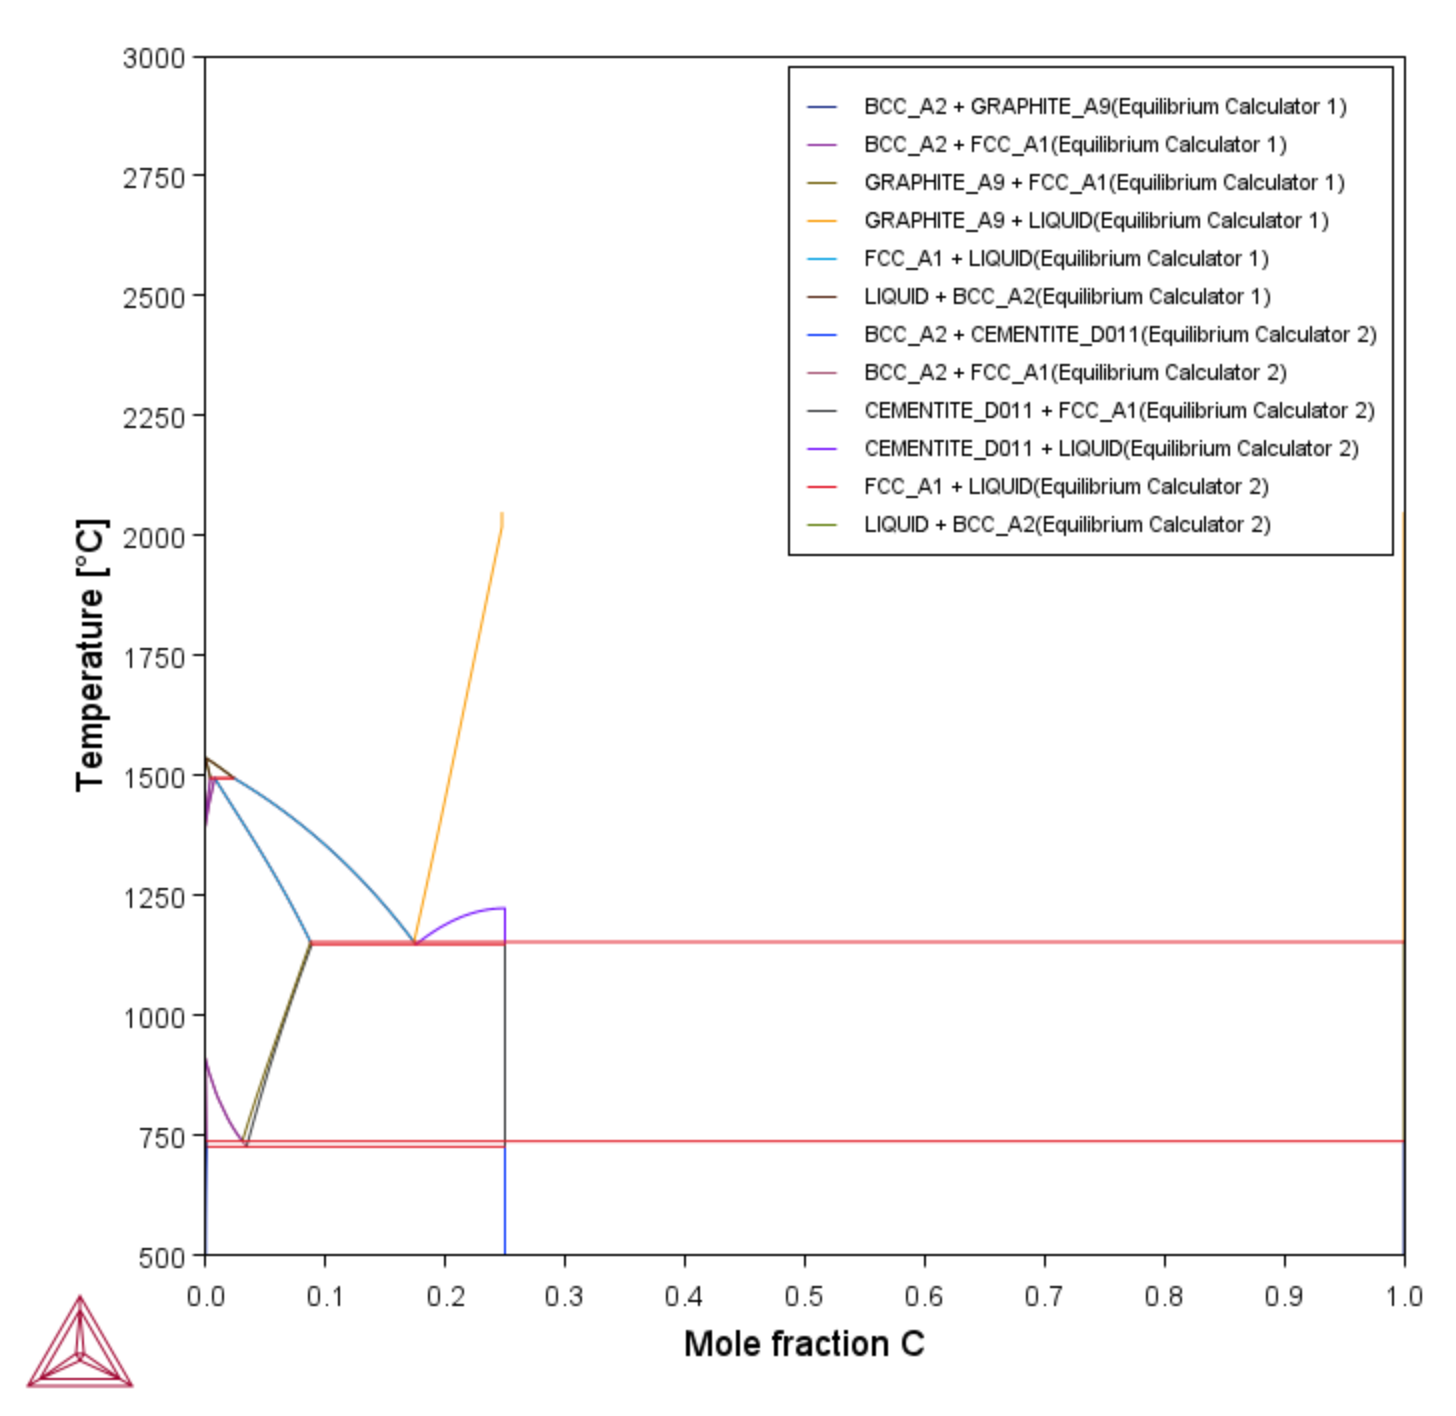
The calculations are plotted in the same diagram in a tab in the Visualizations window. If any of the axis variables of the plots differ, then the label and scale of all calculations are shown parallel to each other.


