Saving and Printing the Output in Graphical Mode
Global Settings: Graphical and Console Mode Plotting
Output can refer to results in the form of tabulated data in a table or a diagram.
The terms diagram and plot are interchangeable. The commands in Console Mode generally use the term diagram and in Graphical Mode it is also called a plot (e.g. the Plot Renderer).
In Graphical Mode the output is displayed in the Visualizations window. The output can be in the form of a table or a diagram (plot). In both cases you can save from the Configuration or Visualizations windows. You can print the table or diagram from the Visualizations window.
Saving a Parallel coordinates plot from the Visualizations window has less file type options. See Plot Type: Parallel Coordinates.
Saving Diagrams
You can save the output in a variety of file formats. For JPG and PNG images you can also adjust the image quality.
In Console Mode, the diagram is output to the Console Results window after using the PLOT_DIAGRAM command.
In Graphical Mode, the diagram is output to the Visualizations window after performing a tree that includes a Plot Renderer.
In the Visualizations window, right-click the diagram and select Save as.
In the Graphical Mode Configuration window you can also click the  Save Diagram (or
  Save table) buttons to open the Save window.
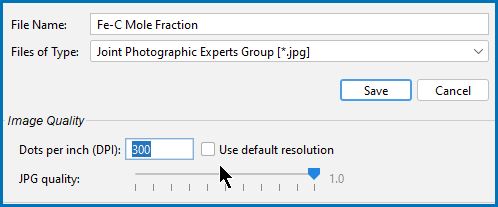
Then in the Save window:
- Navigate to where you want to save the diagram.
- Enter a File name.
- From the Files of type list choose png (the default), jpg, ps, pdf, gif, svg, or emf.
- For PNG and JPG files only, under the Image Quality section, choose to improve the resolution of the image. For JPG files you can also adjust the file size.
- To change the resolution of a PNG or JPG image, click to clear the Use screen resolution checkbox. Then enter a numerical value in the Dots per inch (DPI) field.
- For JPEG files, you can also use the slider to choose a number between 0 and 1 for the JPG quality. The default is 0.9. The lower the number, the smaller the file.
- When you are ready, click Save.
Saving (Exporting) Tables
You can save the table output in different file formats from the Table Renderer and Plot Renderer Configuration and Visualizations windows.
In Graphical Mode, a table is output to the Visualizations window after performing a tree that includes a Table Renderer. It is also output using the  Table View button located on the Plot Renderer Configuration window.
Generate a table. Then depending on which window you are in:
- In the Visualizations window, right-click the table and select Save as, or
- In the Configuration window click the
 Save table button.
Then in the Save As window:
- Navigate to where you want to save the table.
- Enter a File Name.
- From the Files of Type list choose Text [*.txt](the default), Hyper Text Markup [*.html], or Excel [*.xls].
- When you are ready, click Save.
Printing Output
In the Visualizations window, right-click the table or diagram and choose Print. Select additional settings as required on the Print window.
