Plotting Options
The Plot Renderer is a dynamic activity node with options such as being able to:
- add more than one Plot Renderer to its predecessor node (i.e. one of the calculator activities),
- add axes to the plots,
- merge results in one plot,
- filter quantities (only for a Parallel coordinates plot), and
- choose from a variety of plot types based on the selected combination of Calculator and Calculation Type.
Additional settings are also described in Plot Renderer: Configuration Settings.
The specialized Add-on Additive Manufacturing (AM) Module has additional functionality. The information is described separately and included with the Module's documentation.
A Plot Renderer can have several predecessors (if you want to plot several calculations in the same diagram), in which case there are several tabs in the Configuration window, one for each predecessor.
Plotting Several Calculations in One Diagram
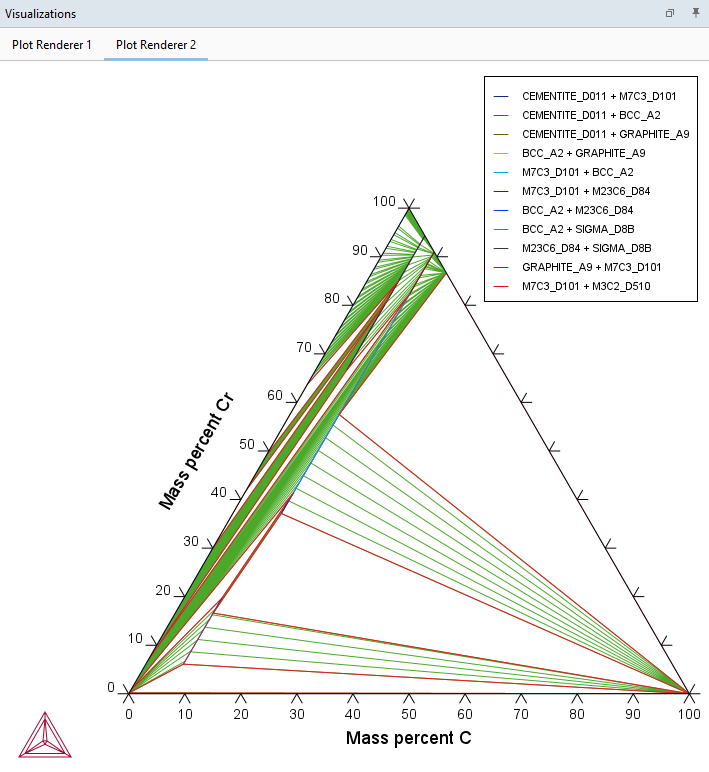
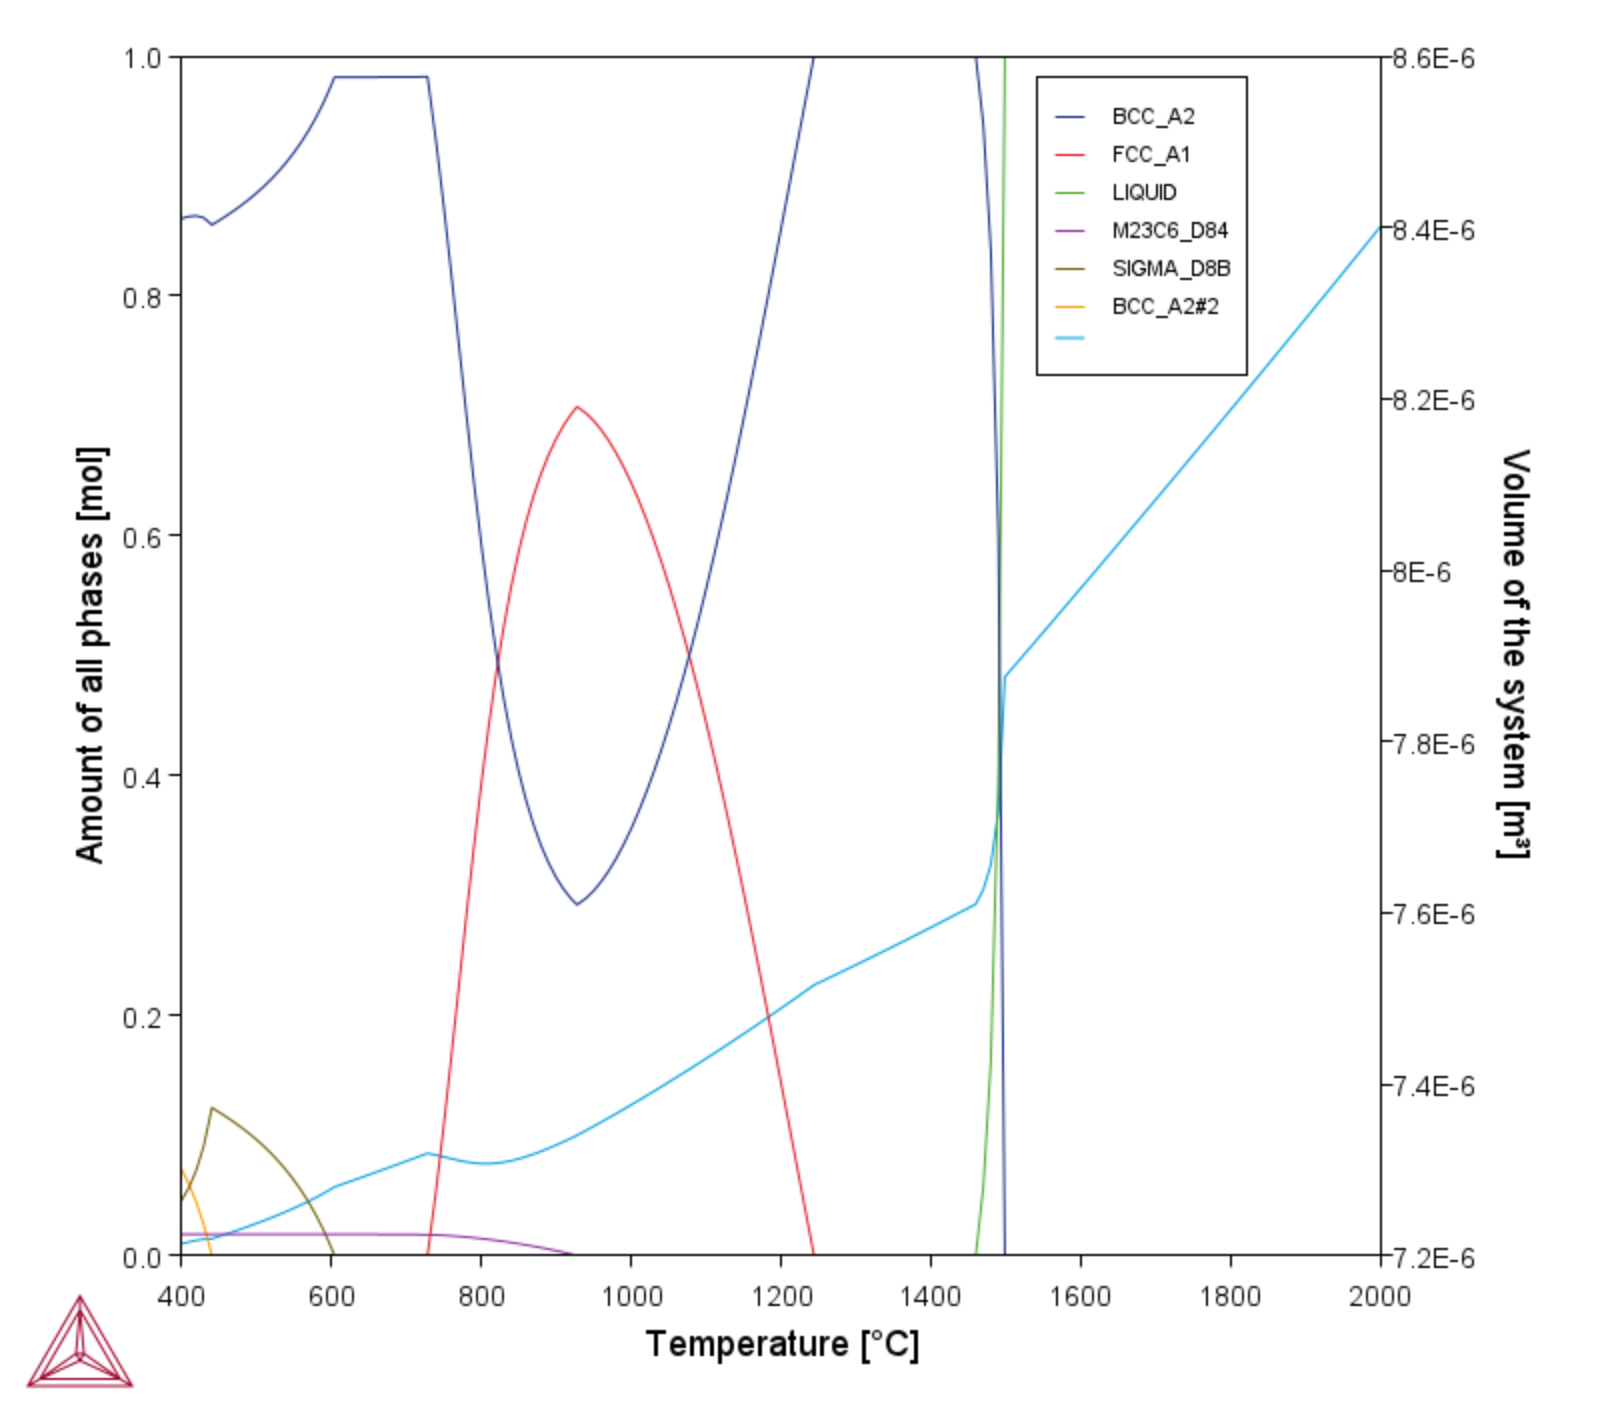
Several Plot Renderer activities (as well as Table Renderer activities) can be shown in the Visualizations window as different tabs. This is an example from Thermo-Calc Graphical Mode T_04_Fe-Cr-C_ternary_phase_diagram.
You can add additional axes (X, Y, and Z for Grid calculations) to a plot to compare two or more variables at the same time.
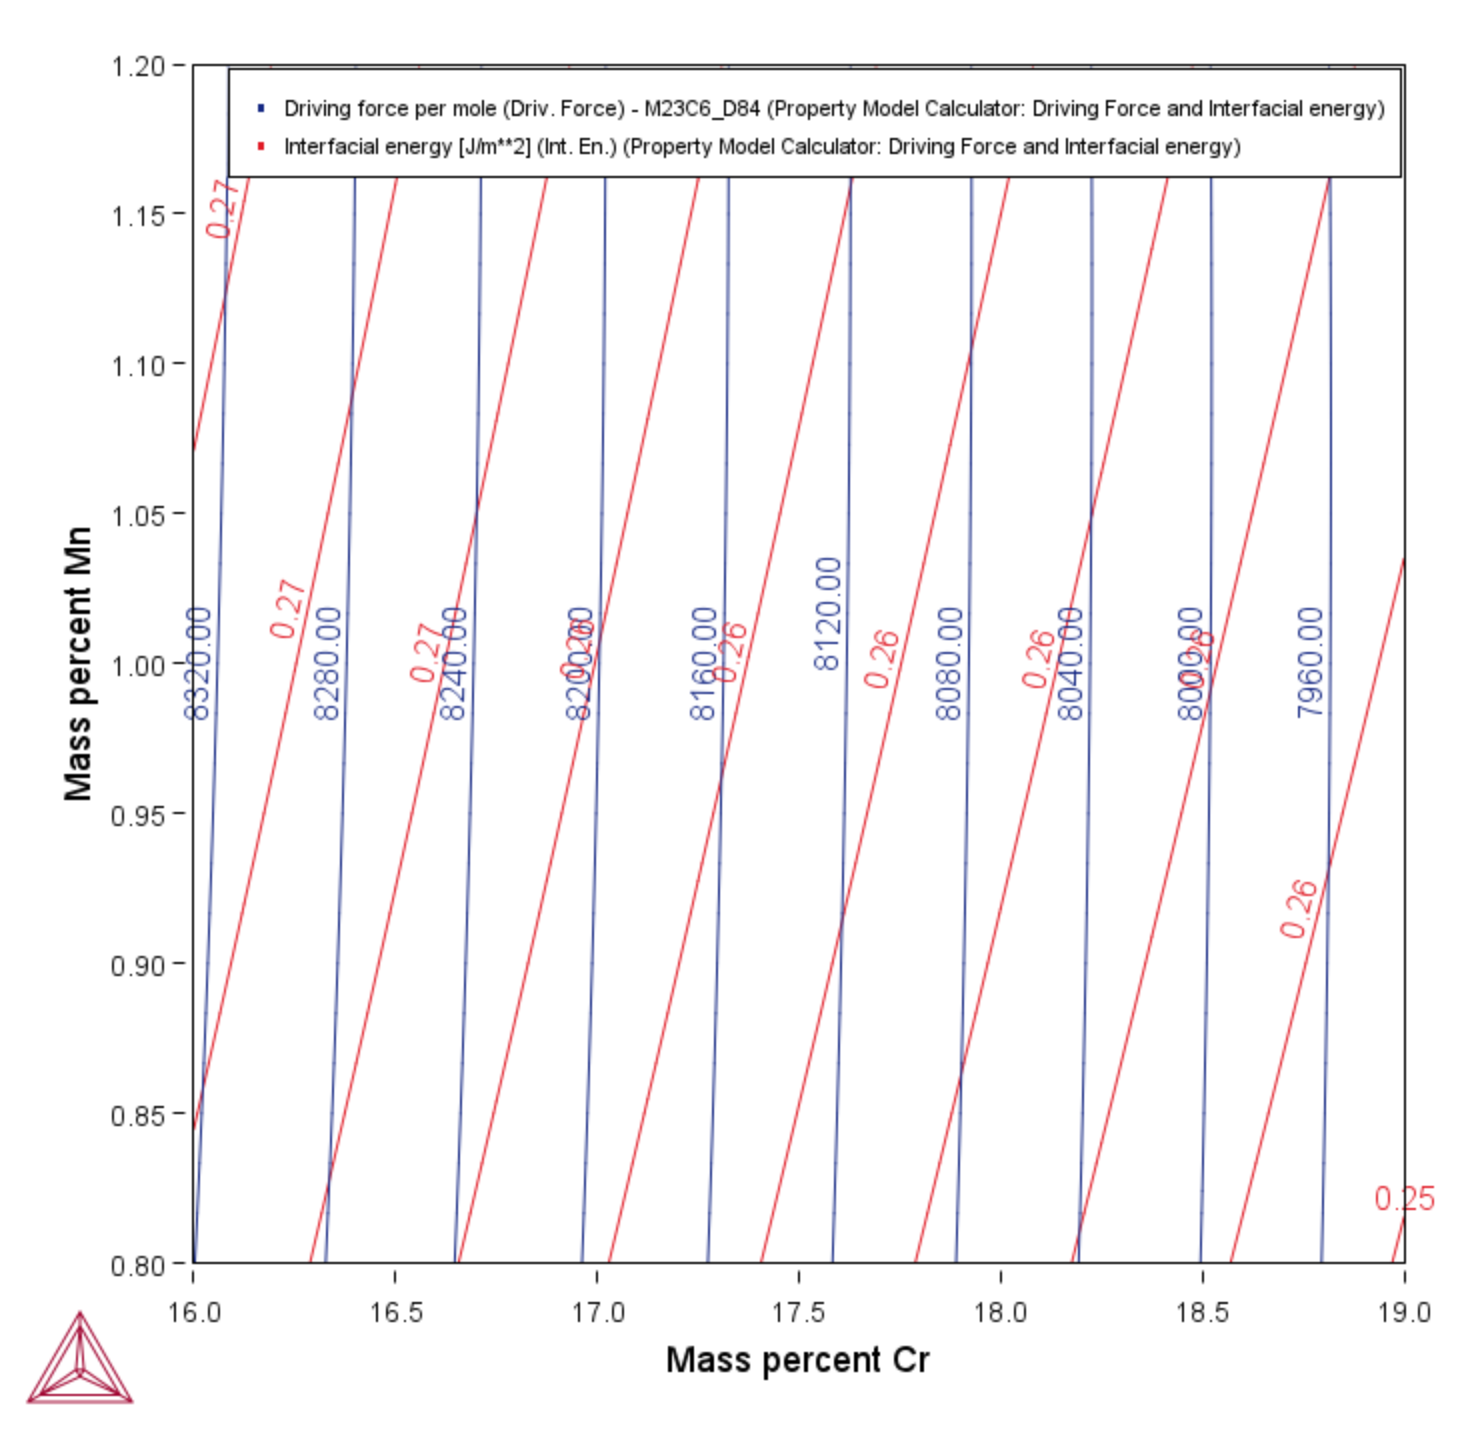
You can merge (or overlay) calculated results for several variables into one plot. This is similar to adding an axis, but instead of displaying different variables along the X- and/or Y-axes, the same X and Y variables are used to compare the third variable (defined in the Plot Renderer as the Z-axis).
As in the figure (from example PM_G_03 in Graphical Mode), the driving force and interfacial energy results are combined into one diagram. The X- and Y-axis is the same for both (Mass percent Cr/Mass percent Mn).
Merging Plots into One Diagram
A contour plot showing both the driving force and interfacial energy calculation results comparing Mass percent Cr to Mass percent Mn. From example PM_G_03.
When you set up most Calculators, there are calculation types to choose from on the Configuration window. The selection of the Calculation Type also provides options to choose from the Plot type menu for some of the associated Plot Renderer windows.
For a list of calculations for each Calculator, see Calculation Types in Graphical Mode.
There are a variety of combinations of Calculator and Calculation Type that offer different Plot Types. These are described in separate topics:
If you also have a license for the Additive Manufacturing Module, there are additional plots available and described in the documentation, i.e. see About the AM Plot Types.
Use the Filter checkbox on a Plot Renderer to add various filters to the Parallel coordinates plot or table and based on the set up of the calculation.
When selected, click the  Add quantity and
  Remove quantity buttons to add filters. For example, enter a Min and Max and choose an axis variable such as Composition Cr and the unit Mass percent to adjust the output in the Visualizations window. Click Perform each time you add or remove a filter for the results to update.


