Global Settings: Graphical and Console Mode Plotting
Globally configure several default plot settings or work with a Theme.
To open the Options window:
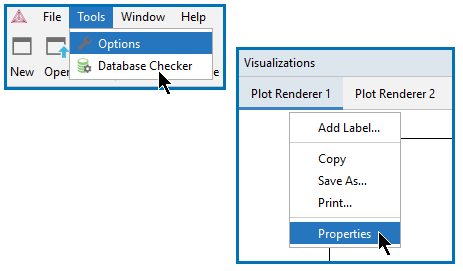
- Windows: Select Tools →
 Options.
 - Mac: Select Thermo-Calc <version> → Preferences or Settings or press <⌘> on the keyboard.
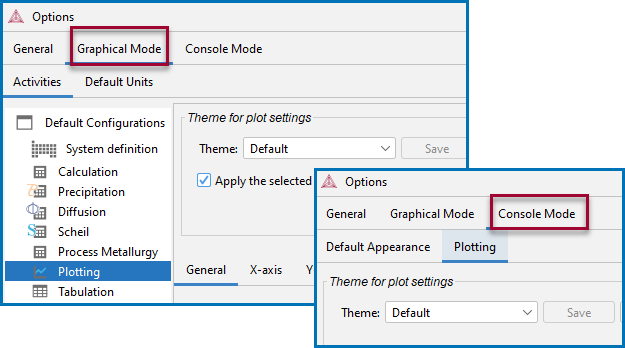
On the Options window you can access the same settings either from the Graphical Mode or Console Mode tabs.
- Click the Graphical Mode → Activities tabs and then click the Plotting node in the tree, or
- Click the Console Mode → Plotting tabs.
The Console Mode and Graphical Mode plot settings are independent of each other once you start making changes to any predefined or custom Themes, or when applying changes to individual plots in either Mode.
There are many options available and these are generally divided into these topics:
- Global Plot Settings: Design the Look and Feel to set a variety of options for titles, legends, labels, fonts, colors, lines, grids, data points, anchors, data points, numbers, and to adjust image quality.
- Global Plot Settings: Themes to create, edit, import, export, rename, or delete plot themes.
- Global Plot Settings: Plot Area Size to set the Plot Area Size.
Global vs Local Plot Settings
For both Graphical Mode and Console Mode, you can work with plots and themes from both the global or local settings windows. Global settings are accessed on the Options window and local plot settings from the Visualizations window when you right-click an individual plot and choose Properties.
Local Plot Property Settings
When you create a new Plot Renderer in Graphical Mode, its initial settings are taken from the default settings and theme. The settings can then be configured individually. Once created, the settings of a Plot Renderer are not affected by changes to the default global settings unless you are working with themes and then save or create a custom theme. See Global Plot Settings: Themes.
To make local changes to the appearance of a specific plot for either Graphical Mode or Console Mode, in the Visualizations window right-click a plot and select Properties. In the Plot Properties window a variety of settings can be made. These are mostly the same settings as in the Options window.
You can also edit some properties for individual plot lines (the color, the line width and type, and whether data points are included). In the Visualizations window, hover the mouse over a plot line. The crosshair cursor turns into a cursor resembling a pointing hand when it is over a line that can be clicked. Alternatively, hold down the <Ctrl> key while you move the cursor around the plot to only display it as a crosshair and prevent unintended edits.
When changes are made that differ from the plot theme applied (i.e. a predefined or custom theme) then blue text next to the theme section alerts you to the change. See Global Plot Settings: Themes for details.
Reset to original settings: In the lower corner of the window, click the Reset to original settings button to restore the original settings. You may have to scroll or expand the window to see the button. For local plot settings, there is a Reset button available instead.

