AM Calculator Experiment File Requirements
The following describes the requirements for importing experimental file data to be used with an AM Calculator either for a Heat Source or Batch Calculation Type and when setting it up on the Configuration window.
AM Calculator Conditions Settings
It is important that the experiment data file contents are correctly entered in order for the calculation to perform smoothly.
Heat Source Calibration Calculations
When the Heat Source Calibration Calculation Type is selected in the Steady-state mode, there is an option to import a file with experimental data points that are used to calibrate the heat source.
Data can also be entered directly into the table on the AM Calculator Configuration window. However, if an Experiment file is imported it needs to be set up in a certain way so that the software can read the data.
These examples use experiment data, key holing, and heat source calibration: AM_06a: Calibrating a Heat Source for a 316L Steel and AM_06b: Using the Calibrated Heat Source for a 316L Steel.
Figure 1: From example AM_06a, this shows the data imported from an experiment file into the table. The "Use" column allows you to choose the points to include or exclude for the simulation. Here row (experiment) #1 is selected to show the data point. Further down in this list, rows 9, 14, 20, and 21 are also selected to be included.
Batch Calculations
When the Batch Calculation Type is selected in the Steady-state mode, there is an option to import a file with experimental data points.
Data can also be entered directly into the table on the AM Calculator Configuration window. However, if an Experiment file is imported it needs to be set up in a certain way so that the software can read the data.
These examples use Batch calculations AM_07: Batch Calculations for an IN718 Alloy, AM_08b: Batch Calculations for a Ti64 Alloy, and AM_09b: Batch Calculations for an SS316L Alloy.
Figure 2: From example AM_08b, this shows the data imported from an experiment file into the table. Here the "Use" checkbox for Experiment 1 is about to be deselected to exclude the data point after previewing it on the Visualizations window.
Experiment File Requirements
Only the columns described here are read / used in the calculation. It is important to enter the information exactly as described. All header text (the first line in the file) must also be written in English, i.e. no translations into other languages will be read correctly by the experiment file.
The experiment file is set up as follows.
- The first row in the file is the header.
- Include only four columns in the file and these must be in the following order and must use the indicated units.
Default Global units (i.e. set via the Tools → Options menu) are not applicable. The data must be in the indicated units.
- Power (unit = W)
- Scanning Speed (unit = mm/s)
- Width of the melt pool (unit = μm)
- Depth of the melt pool (unit = μm)
-
All of the values entered or imported to the table must be positive and greater than zero.
If you select Depth from the Calibrate for list, then the experimental values for only the melt pool depth is needed.
Do not include the following in the file:
- # this is the experiment number that is automatically associated to each imported or entered set of data. It is used to identify the applicable rows by a unique number so that you can easily identify these points (i.e. points are identified by labels on the plots), or when choosing to include or exclude the experiment point from the simulation or later from a plot.
- P/v (J/mm). This is the energy density and is defined as the ratio of power and scanning speed. This is not included in any data file. This is automatically calculated based on the Power and Speed entered or included in the file (i.e it is defined as the ratio of power and scanning speed).
- Use. This column is not part of the text file, it is available once the data is imported or entered in the table. Then you can choose to include or exclude specific data points as you examine this output in the Visualizations window.
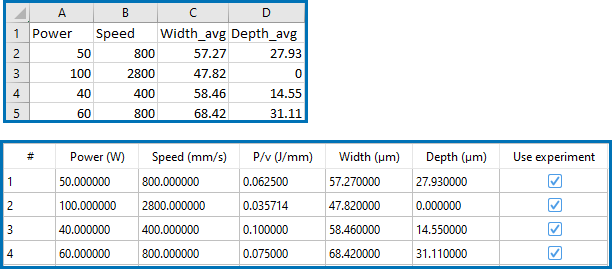
Figure 3: An example of the original experiment data file, with the four headings in the correct order and these do not need the units included here. When the file is imported, there is a standard header that is kept, plus the additional columns (i.e. #, P/V, and Use experiment), which are automatically available and updated as needed.
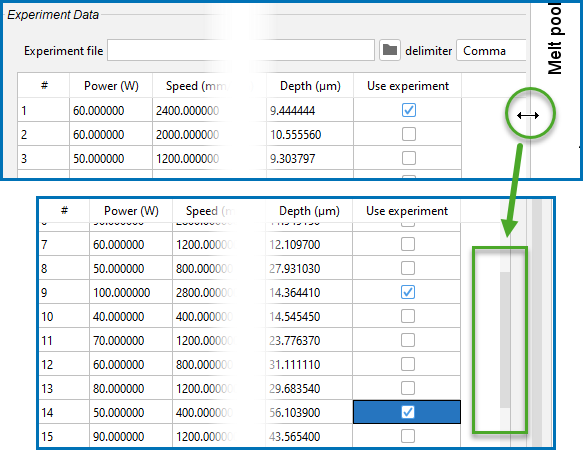
Once a set of data is imported to the table (or entered manually), expand the Configuration window to reveal the scroll bars. Then you can scroll up or down, left or right, within the table to select checkboxes for the relevant data points you want to include or exclude. This is applicable to the tables found on the AM Calculator as well as those on the Plot Renderer for the data.
You can edit the table after importing data, or manually enter information. To add a row, scroll to the bottom of the table and press <Enter>.


