Electrical Resistivity and Thermal Conductivity
Using Thermo‑Calc with the TCS Al-based Alloy Database (TCAL), you can calculate the quantities of a phase φ with the variables ELRS(φ) and THCD(φ), or a system (i.e. alloy) with ELRS and THCD. You can also calculate the derived quantities, i.e. electrical conductivity (ELCD), thermal resistivity (THRS) and thermal diffusivity (THDF) in a similar way.
The database includes electrical resistivity and thermal conductivity starting with version 7 (TCAL7).
Wrought Al Alloys
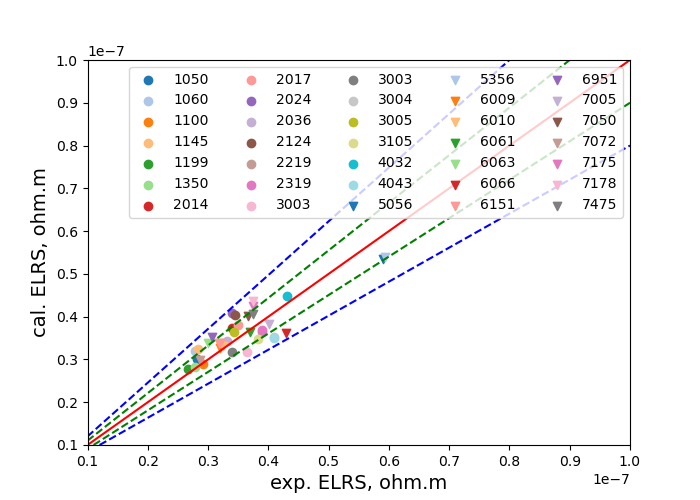
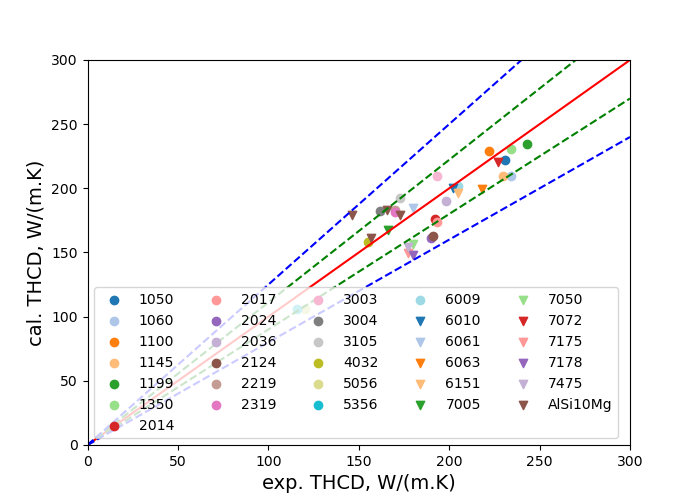
This example compares the calculated ELRS (Figure 1) and THCD (Figure 2) with tabulated data for typical Al alloys after “O” heat treatments. For each alloy, an equilibrium calculation is first performed at 350 °C (assumed annealing temperature), so phases that are present, and their fractions and compositions are obtained with Thermo‑Calc. Then the temperature is changed to 25 °C (measuring temperature), and the value of ELRS is directly retrieved without equilibrium-computing.
For alloys produced with other treatments, sometimes you have to take into account impacts of deformations and precipitations, and so forth. For as-cast alloys, you can use Scheil simulations (with or without back diffusion) to predict the phases, as well as the fractions and compositions, and then evaluate ELRS and THCD appropriately.
Read more about Scheil Solidification Simulations on our website, including how to select the right model for your simulation. If you are in Thermo‑Calc, press F1 to search the help to learn about using Scheil.
Figure 1: Compares the calculated ELRS with tabulated data for 35 wrought Al alloys after “O” heat treatments. The calibration is assumed to be proportional to the total fraction of grain boundary phases with a coefficient of +4.83e-8 ohm.m. The red solid line indicates where calculated values are equal to experimental data. The blue dashed lines mark the limits for 20 % deviations and the green dashed lines for 10 % deviations. The data are from ASM [1990].
Figure 2: Compares the calculated THCD with tabulated data for 31 Al alloys after "O" heat treatments. The calibration of THCD is based on that of ELRS, assuming they obey the Wiedemann-Franz Law. The red solid line indicates where calculated values are equal to experimental data. The blue dashed lines mark the limits for 20 % deviations and the green dashed lines for 10 % deviations. The data are from ASM [1990].
References
[1972Ho] C. Y. Ho, R. W. Powell, P. E. Liley, Thermal Conductivity of the Elements. J. Phys. Chem. Ref. Data. 1, 279–421 (1972).
[1983Ho] C. Y. Ho, M. W. Ackerman, K. Y. Wu, T. N. Havill, R. H. Bogaard, R. A. Matula, S. G. Oh, H. M. James, Electrical Resistivity of Ten Selected Binary Alloy Systems. J. Phys. Chem. Ref. Data. 12, 183–322 (1983).
[1990ASM] Properties and selection: nonferrous alloys and special-purpose materials, in ASM Handbook 10th edition, Metals Handbook. ASM International, 1990.

