Solidification: Microsegregation
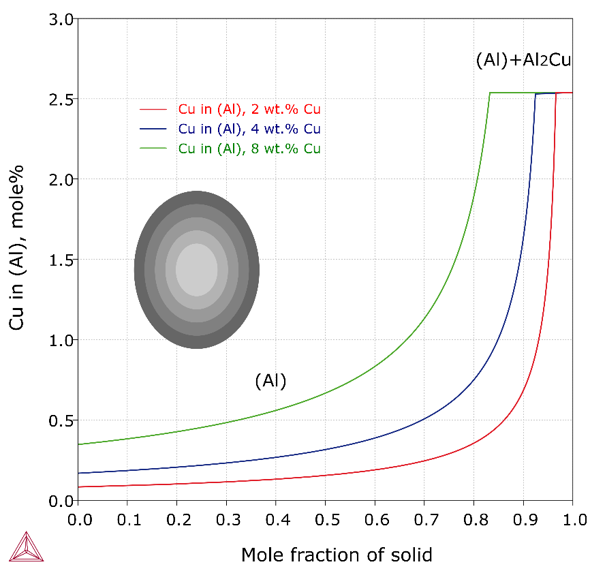
Microsegregation can be easily predicted by the formation of grain boundaries phases and the composition profile of the (Al) matrix phase. The former has been demonstrated in another example, Solidification: Phase Formation. Figure 1 shows the (Al) profiles in Al-2, 4, and 8 wt.% Cu alloys from Scheil simulations using the TCS Al-based Alloy Database (TCAL). In the Figure 2 micrograph, the simulated profiles indicate that:
- The cores of (Al) grains are lean in Cu. Increasing the alloy composition increases the Cu content in the cores.
- The maximum Cu content in the outer rims of (Al) grains is independent of the alloy composition.
- The outer rims are thickened with increasing the Cu content in the alloys.
Read more about Scheil Solidification Simulations on our website, including how to select the right model for your simulation. If you are in Thermo‑Calc, press F1 to search the help to learn about using Scheil.
Reference
[2005Kur] E. C. Kurum, H. B. Dong, J. D. Hunt, Microsegregation in Al-Cu Alloys. Metall. Mater. Trans. A, 36, 3103 (2005).

![A micrograph from Kurum [2005] A micrograph from Kurum [2005]](../../../resources/images/tcal/segregation_exp_2005kurum.png)