CaO-SiO2-YO1.5 and CaO-SiO2-GdO1.5
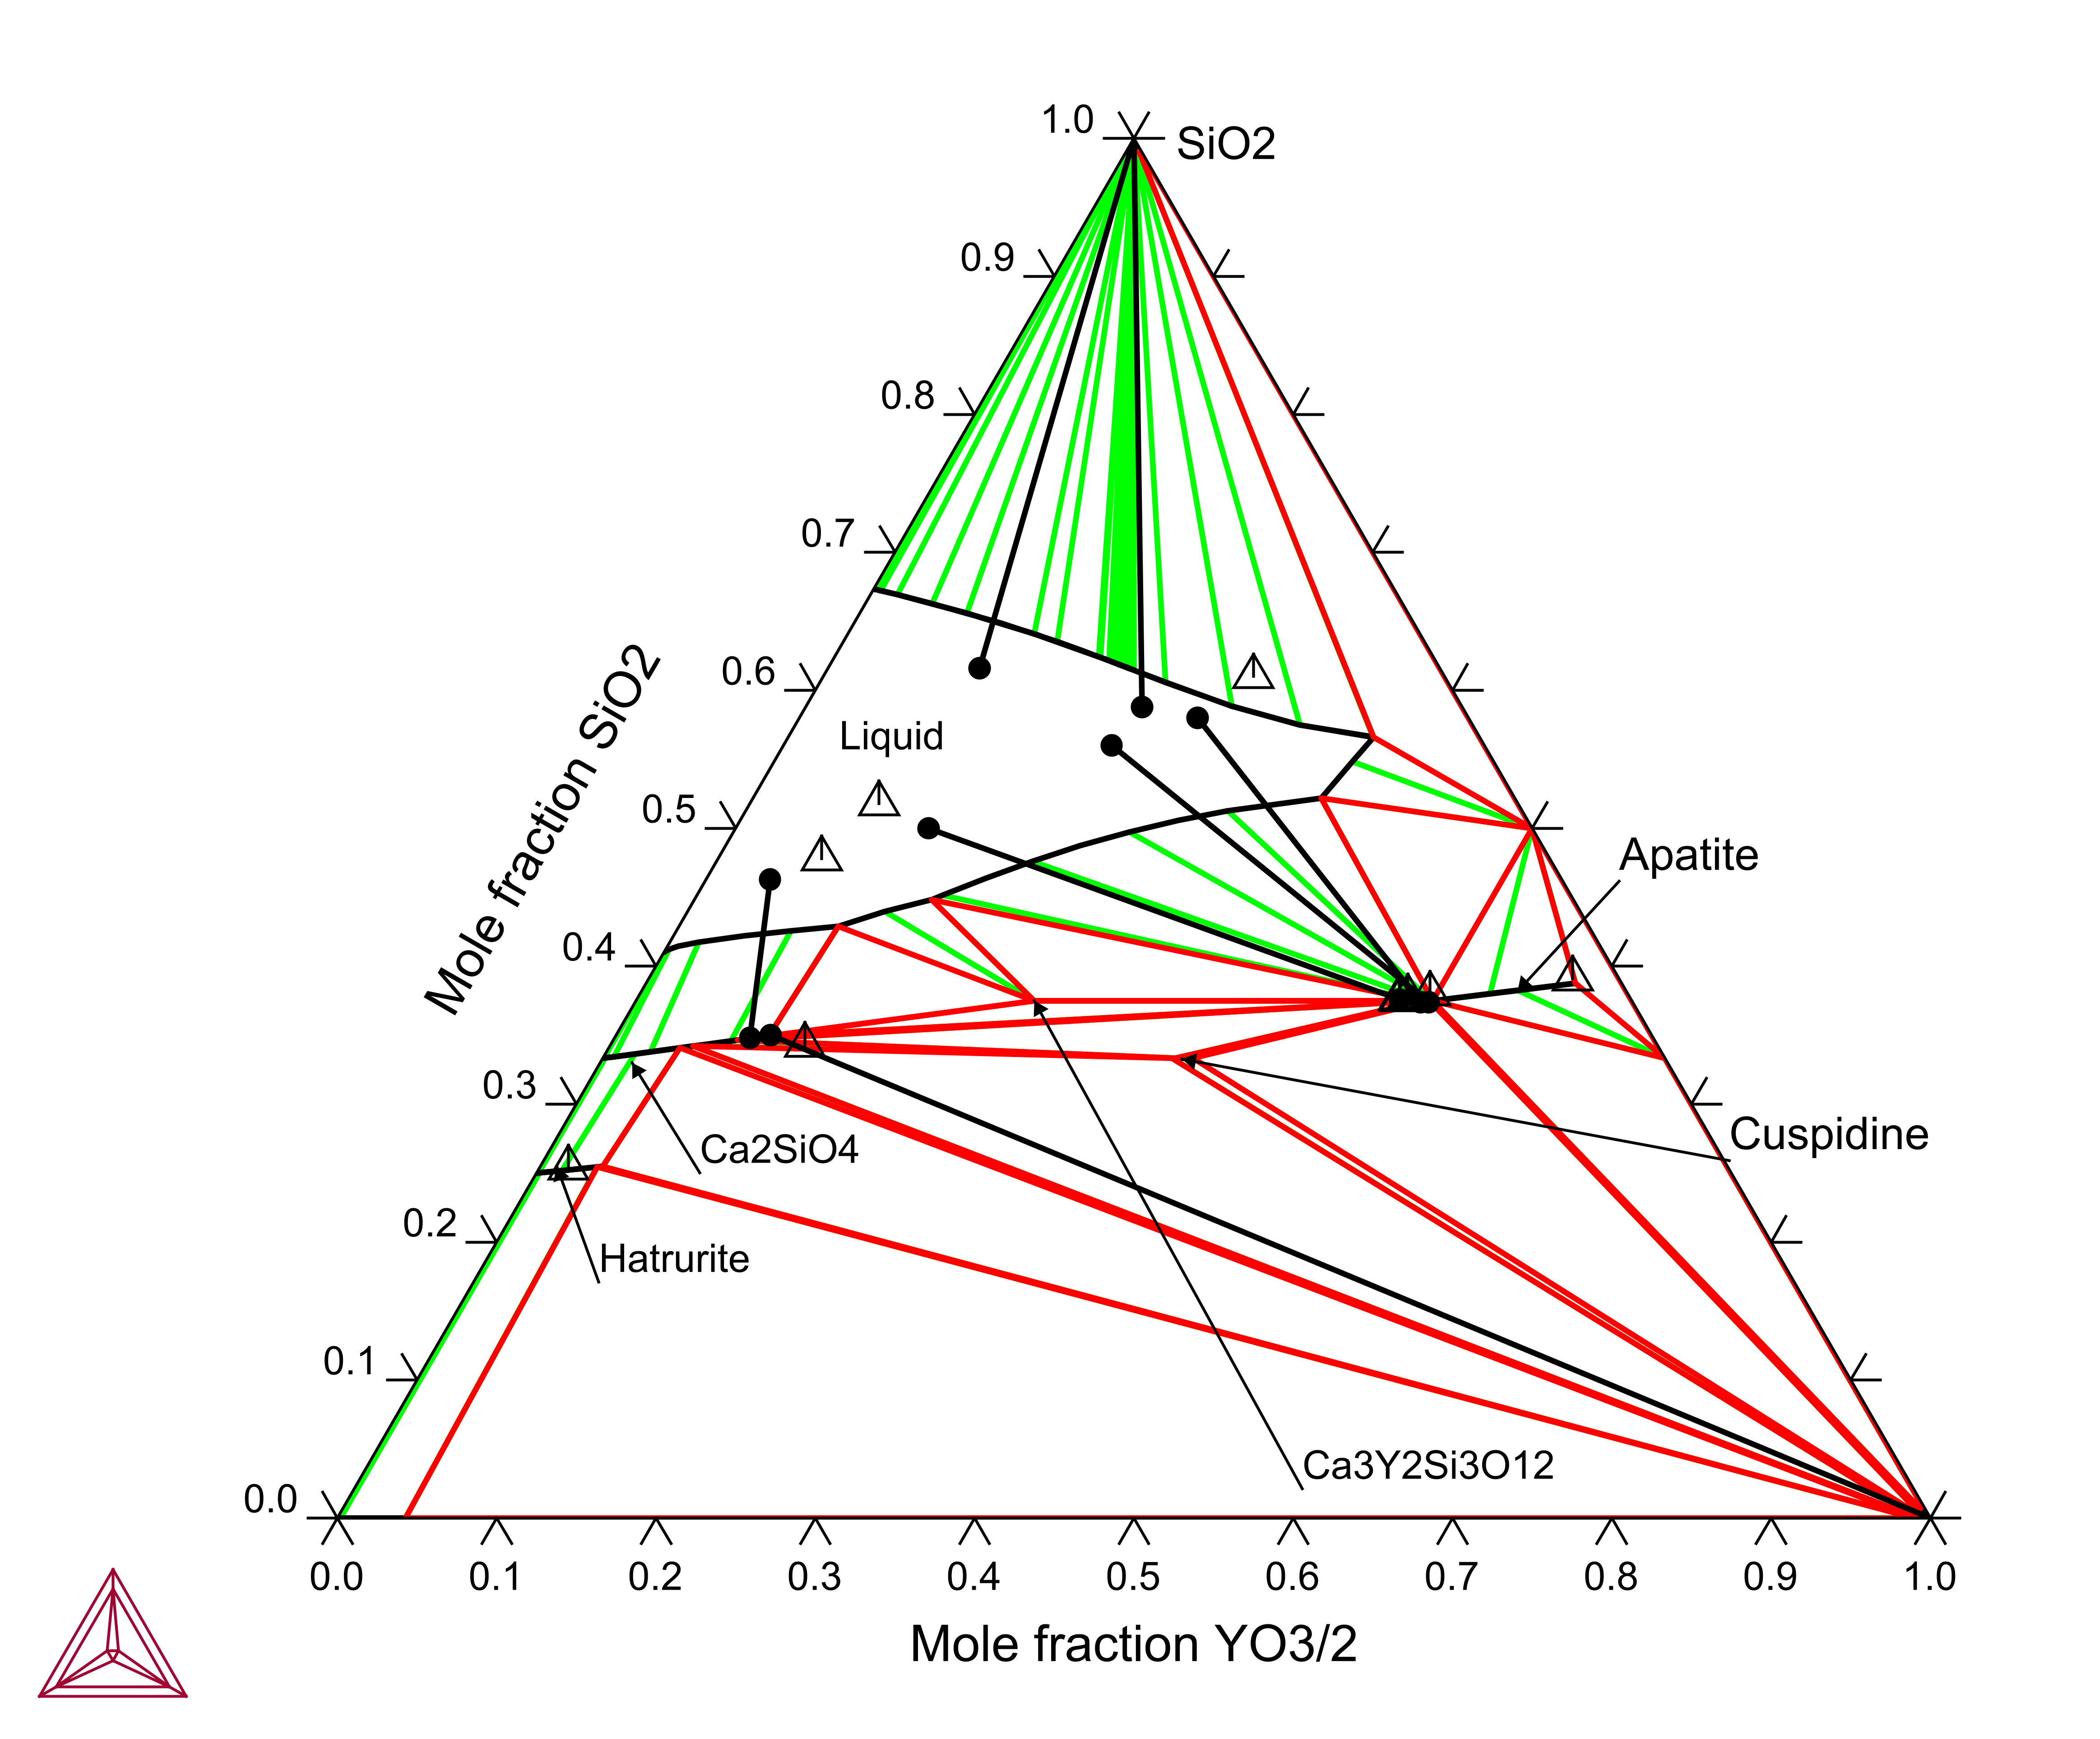
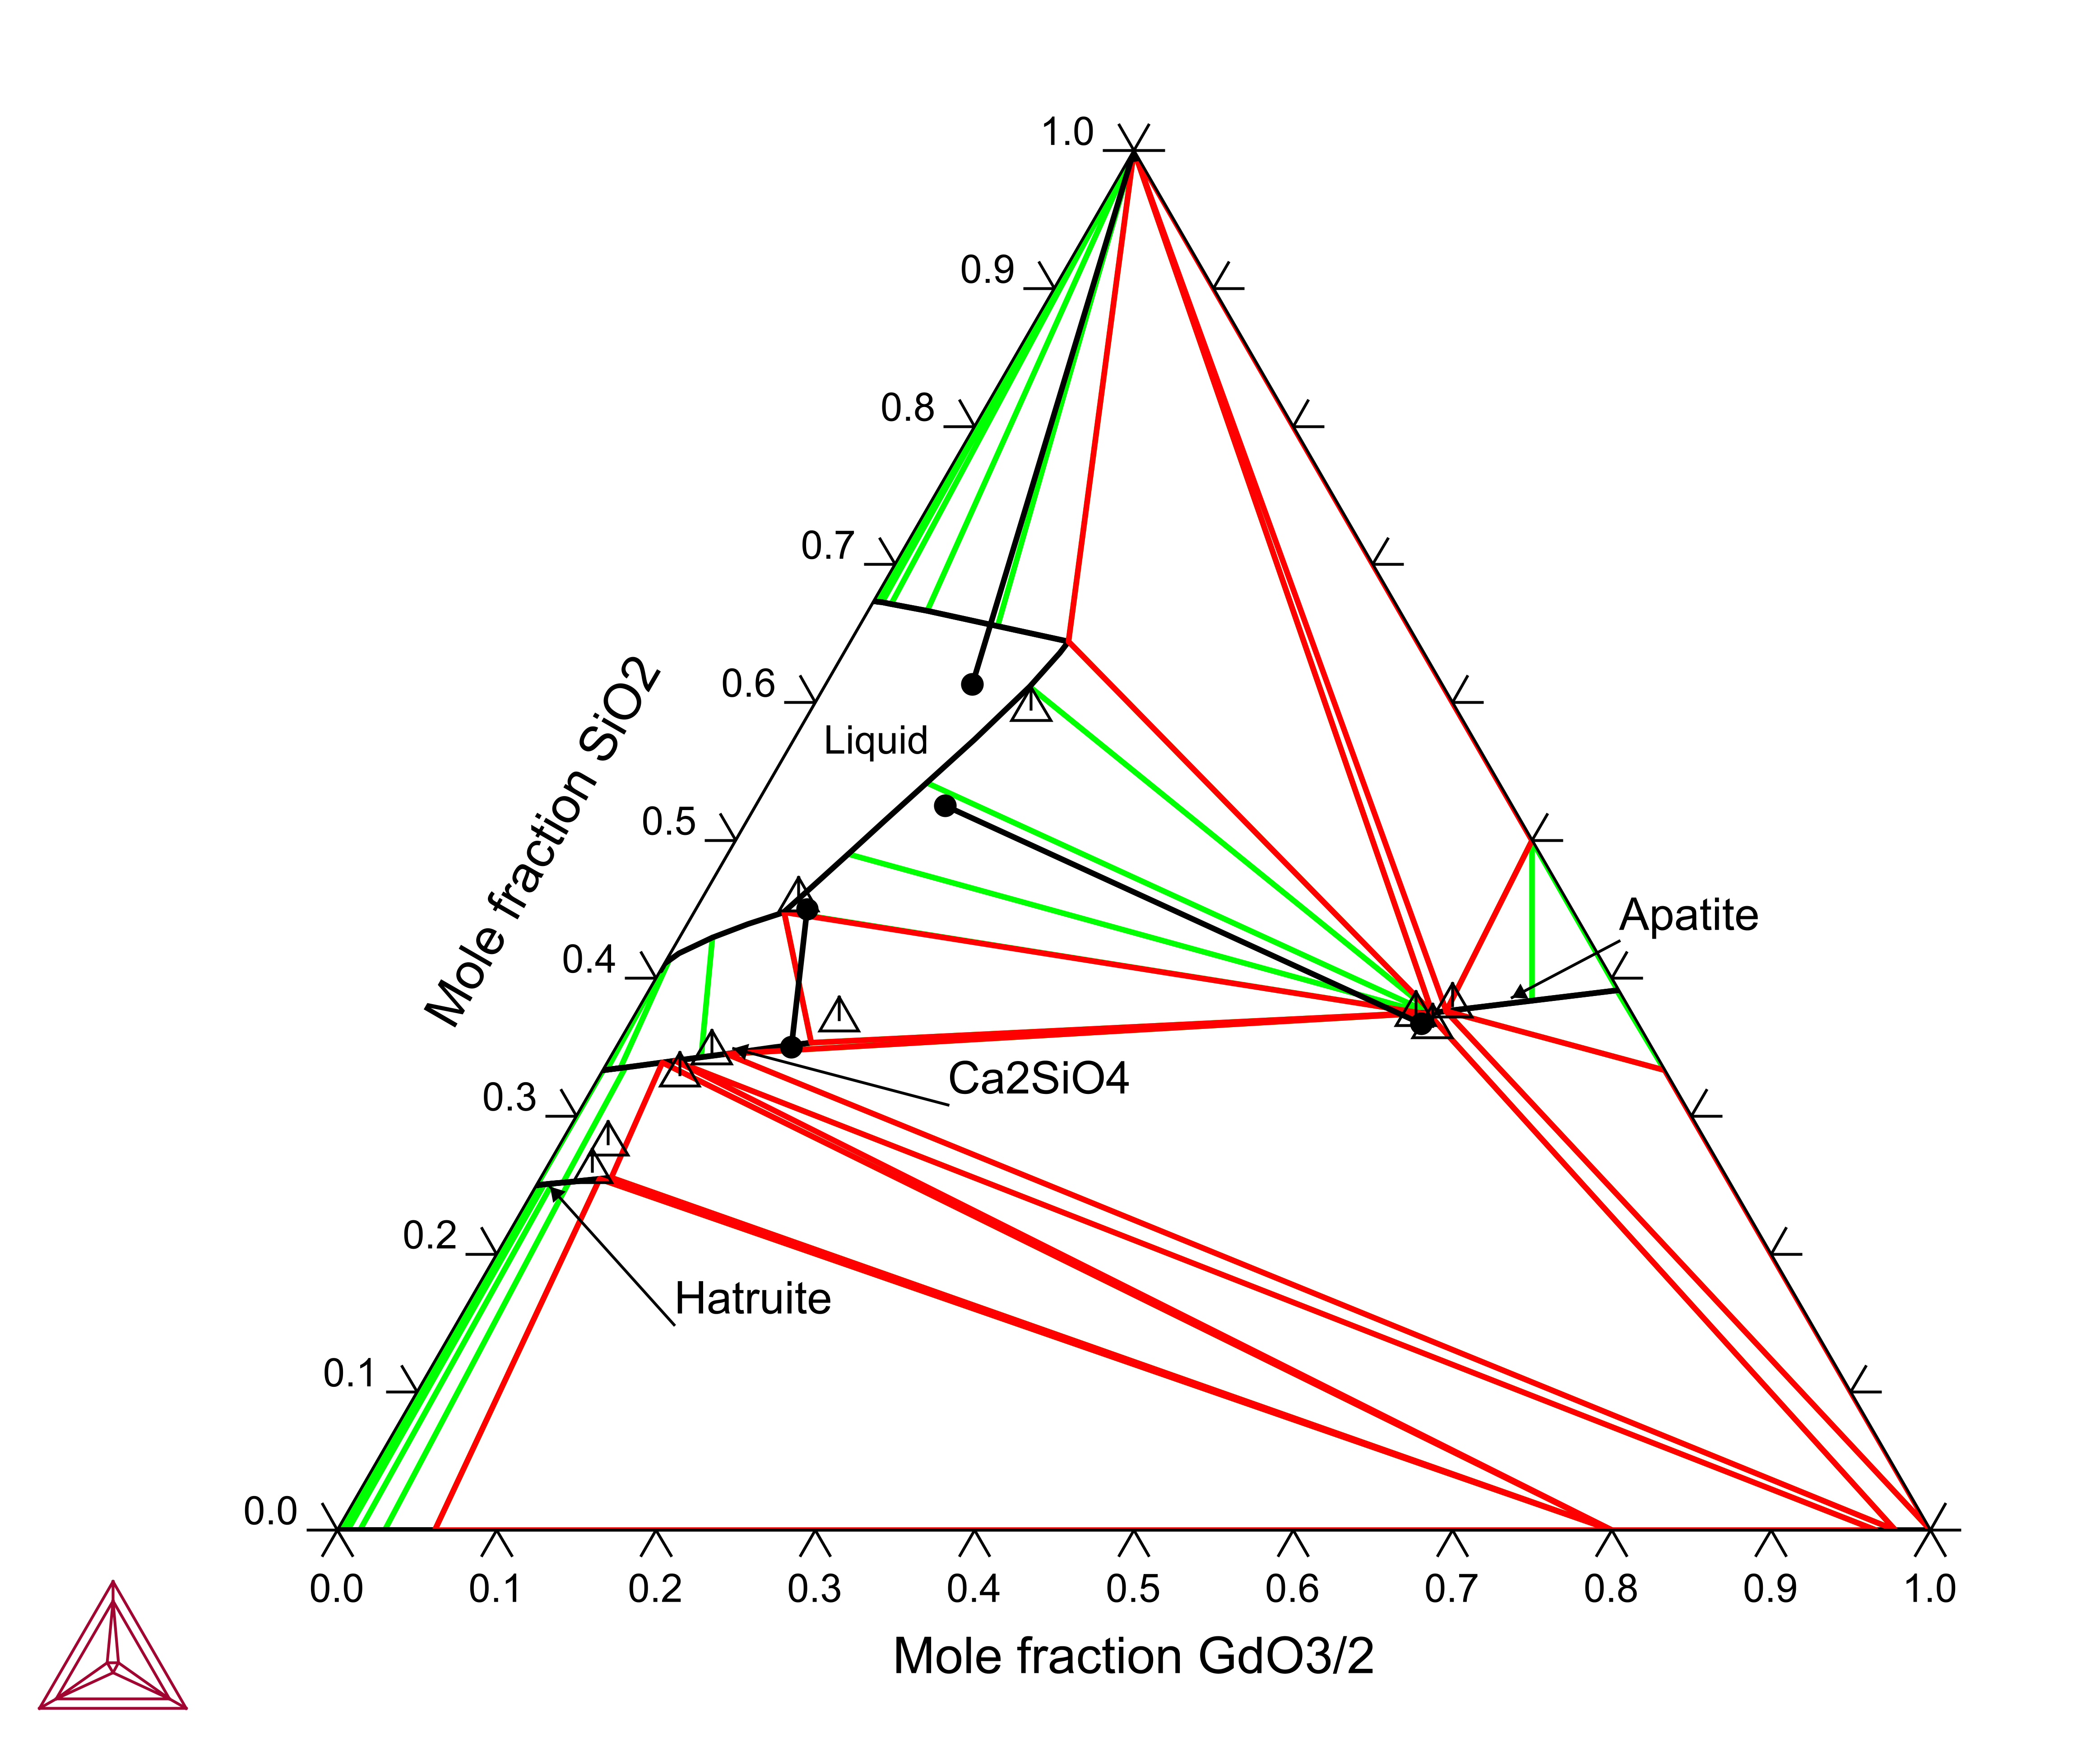
The isothermal sections comparing data on 3-phase corners and tie-lines for this example using the TCS Metal Oxide Solutions Database (TCOX) are taken from Poerschke [2017/2016a/2016bPoe].
Figure 1: Calculated isothermal section of CaO-SiO2-YO1.5 at 1600 °C, compared to data on 3-phase corners and tie-lines.
Figure 2: Calculated isothermal section of CaO-SiO2-GdO1.5 at 1600 °C, compared to data on 3-phase corners and tie-lines.
References
[2016aPoe] D. L. Poerschke, T. L. Barth, O. Fabrichnaya, C. G. Levi, Phase equilibria and crystal chemistry in the calcia–silica–yttria system. J. Eur. Ceram. Soc. 36, 1743–1754 (2016).
[2016bPoe] D. L. Poerschke, T. L. Barth, C. G. Levi, Equilibrium relationships between thermal barrier oxides and silicate melts. Acta Mater. 120, 302–314 (2016).
[2017Poe] D. L. Poerschke, C. G. Levi, Phase equilibria in the calcia-gadolinia-silica system. J. Alloys Compd. 695, 1397–1404 (2017).

