Predicting Phase Stability: Applications Involving P
These examples using the TCS Ni-based Superalloys Database (TCNI) include the use of the recently added element, phosphorus (P). The example is also a overview of the use of the different calculation types available: Material to Material Calculator, Diffusion Calculator, and Scheil Calculator.
For other examples using P, see Prediction of Phase Stability with Minor Amounts of P in Ni‑base Superalloys and Isothermal Solidification During Brazing: A Diffusion Simulation.
Predicting Phase Stability with the Material to Material Calculator
The Material to Material Calculator, which is available for all Thermo-Calc users, allows for a straight-forward prediction of phase diagrams with a composition varying between two materials.
Read more on our website about the Material to Material Calculator. If you are in Thermo‑Calc, press F1 to search the help.
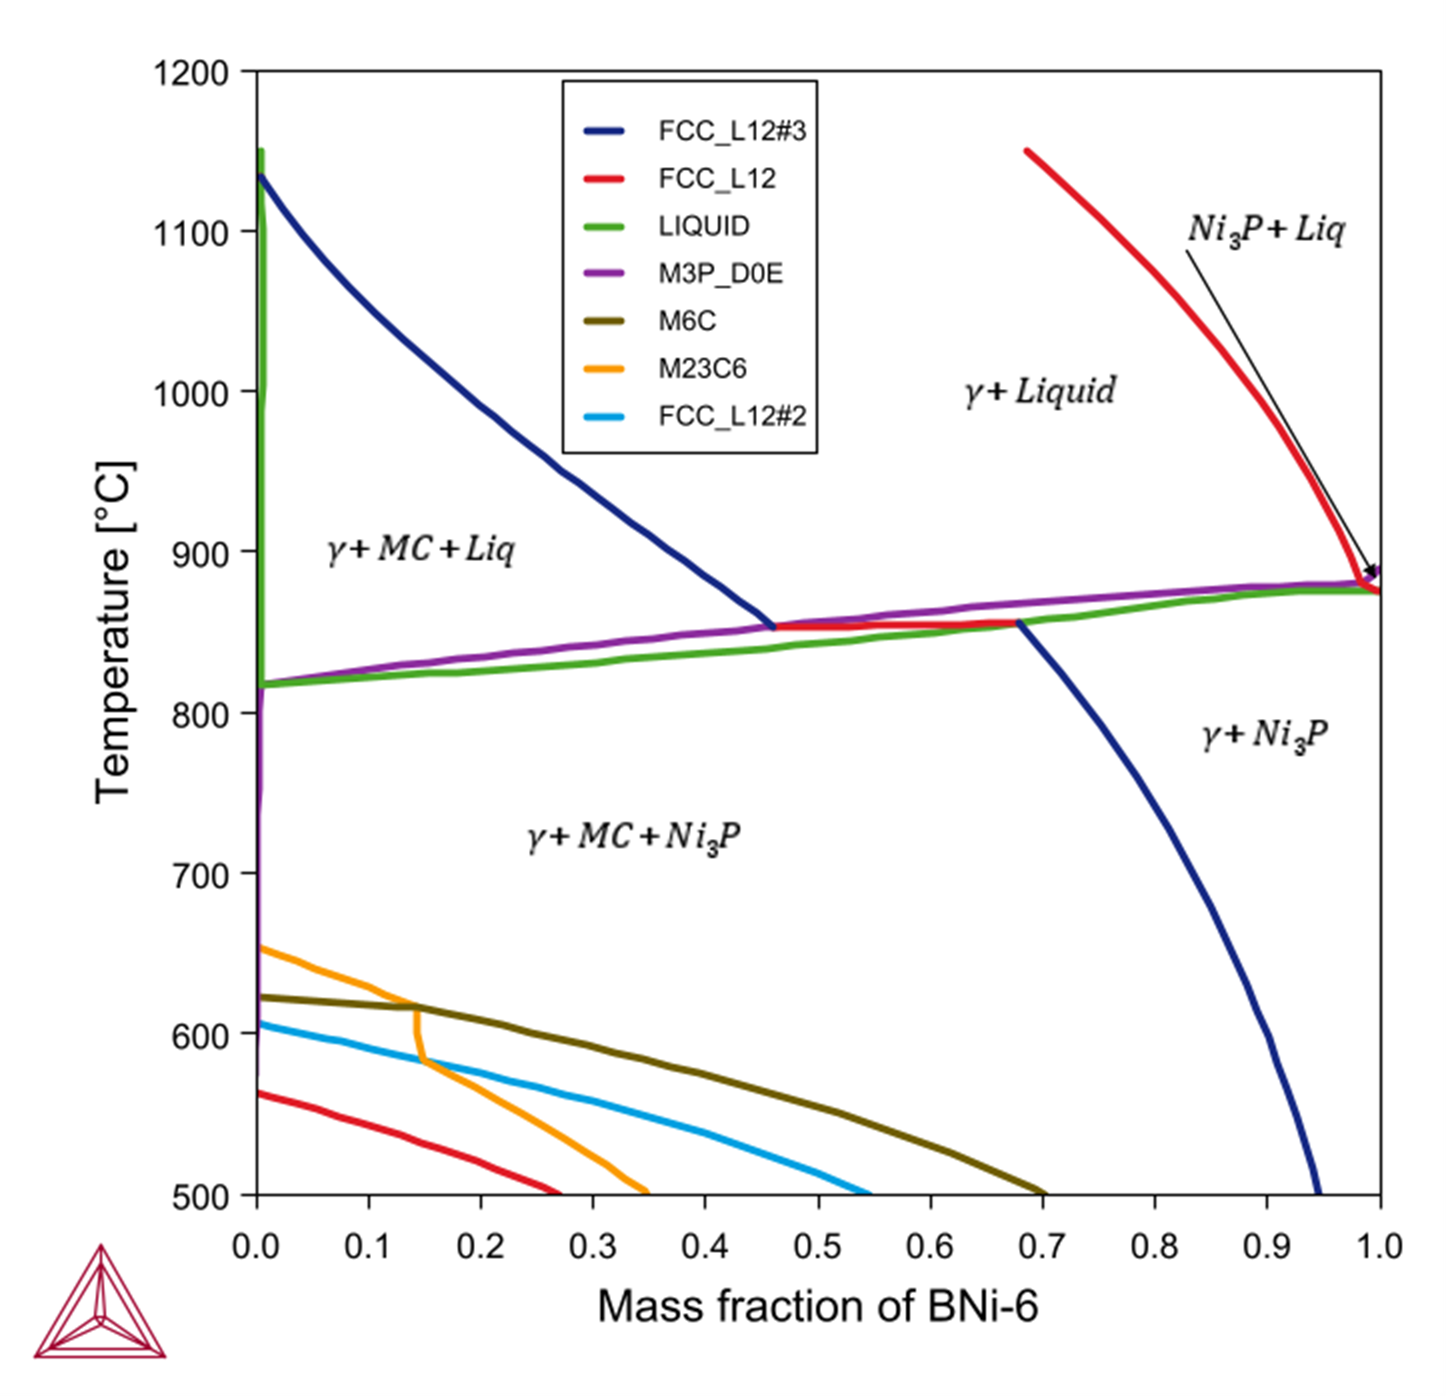
The following shows the predicted stable phases with varying mass fraction of Ni‑11P (BNi‑6) filler mixed with Ni‑base alloy GH3039 (Ni-15Cr-1.4Fe-1.7Mo-0.7Nb-0.3Ti-0.5Al-0.08C). In Figure 1, the far left edge represents pure GH3039, and the far right represents pure BNi‑6. The red line represents the liquidus of the alloy. We can expect that while cooling, and if there is any liquid filler left in the joint, then it might form a microstructure of  .
.
Figure 1: A material-to-material calculation mixing a Ni-base alloy GH3039 with a brazing filler BNi-6. Labels show which phase is formed or disappears while passing through a line.
Predicting Phase Stability with the Diffusion Module (DICTRA)
In the next example, both the thermodynamic TCS Ni-based Superalloys Database (TCNI) and its compatible kinetic TCS Ni-alloys Mobility Database (MOBNI) are used with the Add-on Diffusion Module (DICTRA) to further examine the set up started with the Material to Material Calculator. The Diffusion Module (DICTRA) requires an additional license although all users can use a demonstration version with up to three components.
Read more about the Diffusion Module (DICTRA) on our website. There is also a Getting Started with the Diffusion Module (DICTRA) page available. If you are in Thermo‑Calc, press F1 to search the help to learn about the available settings included with the Add-on Module.
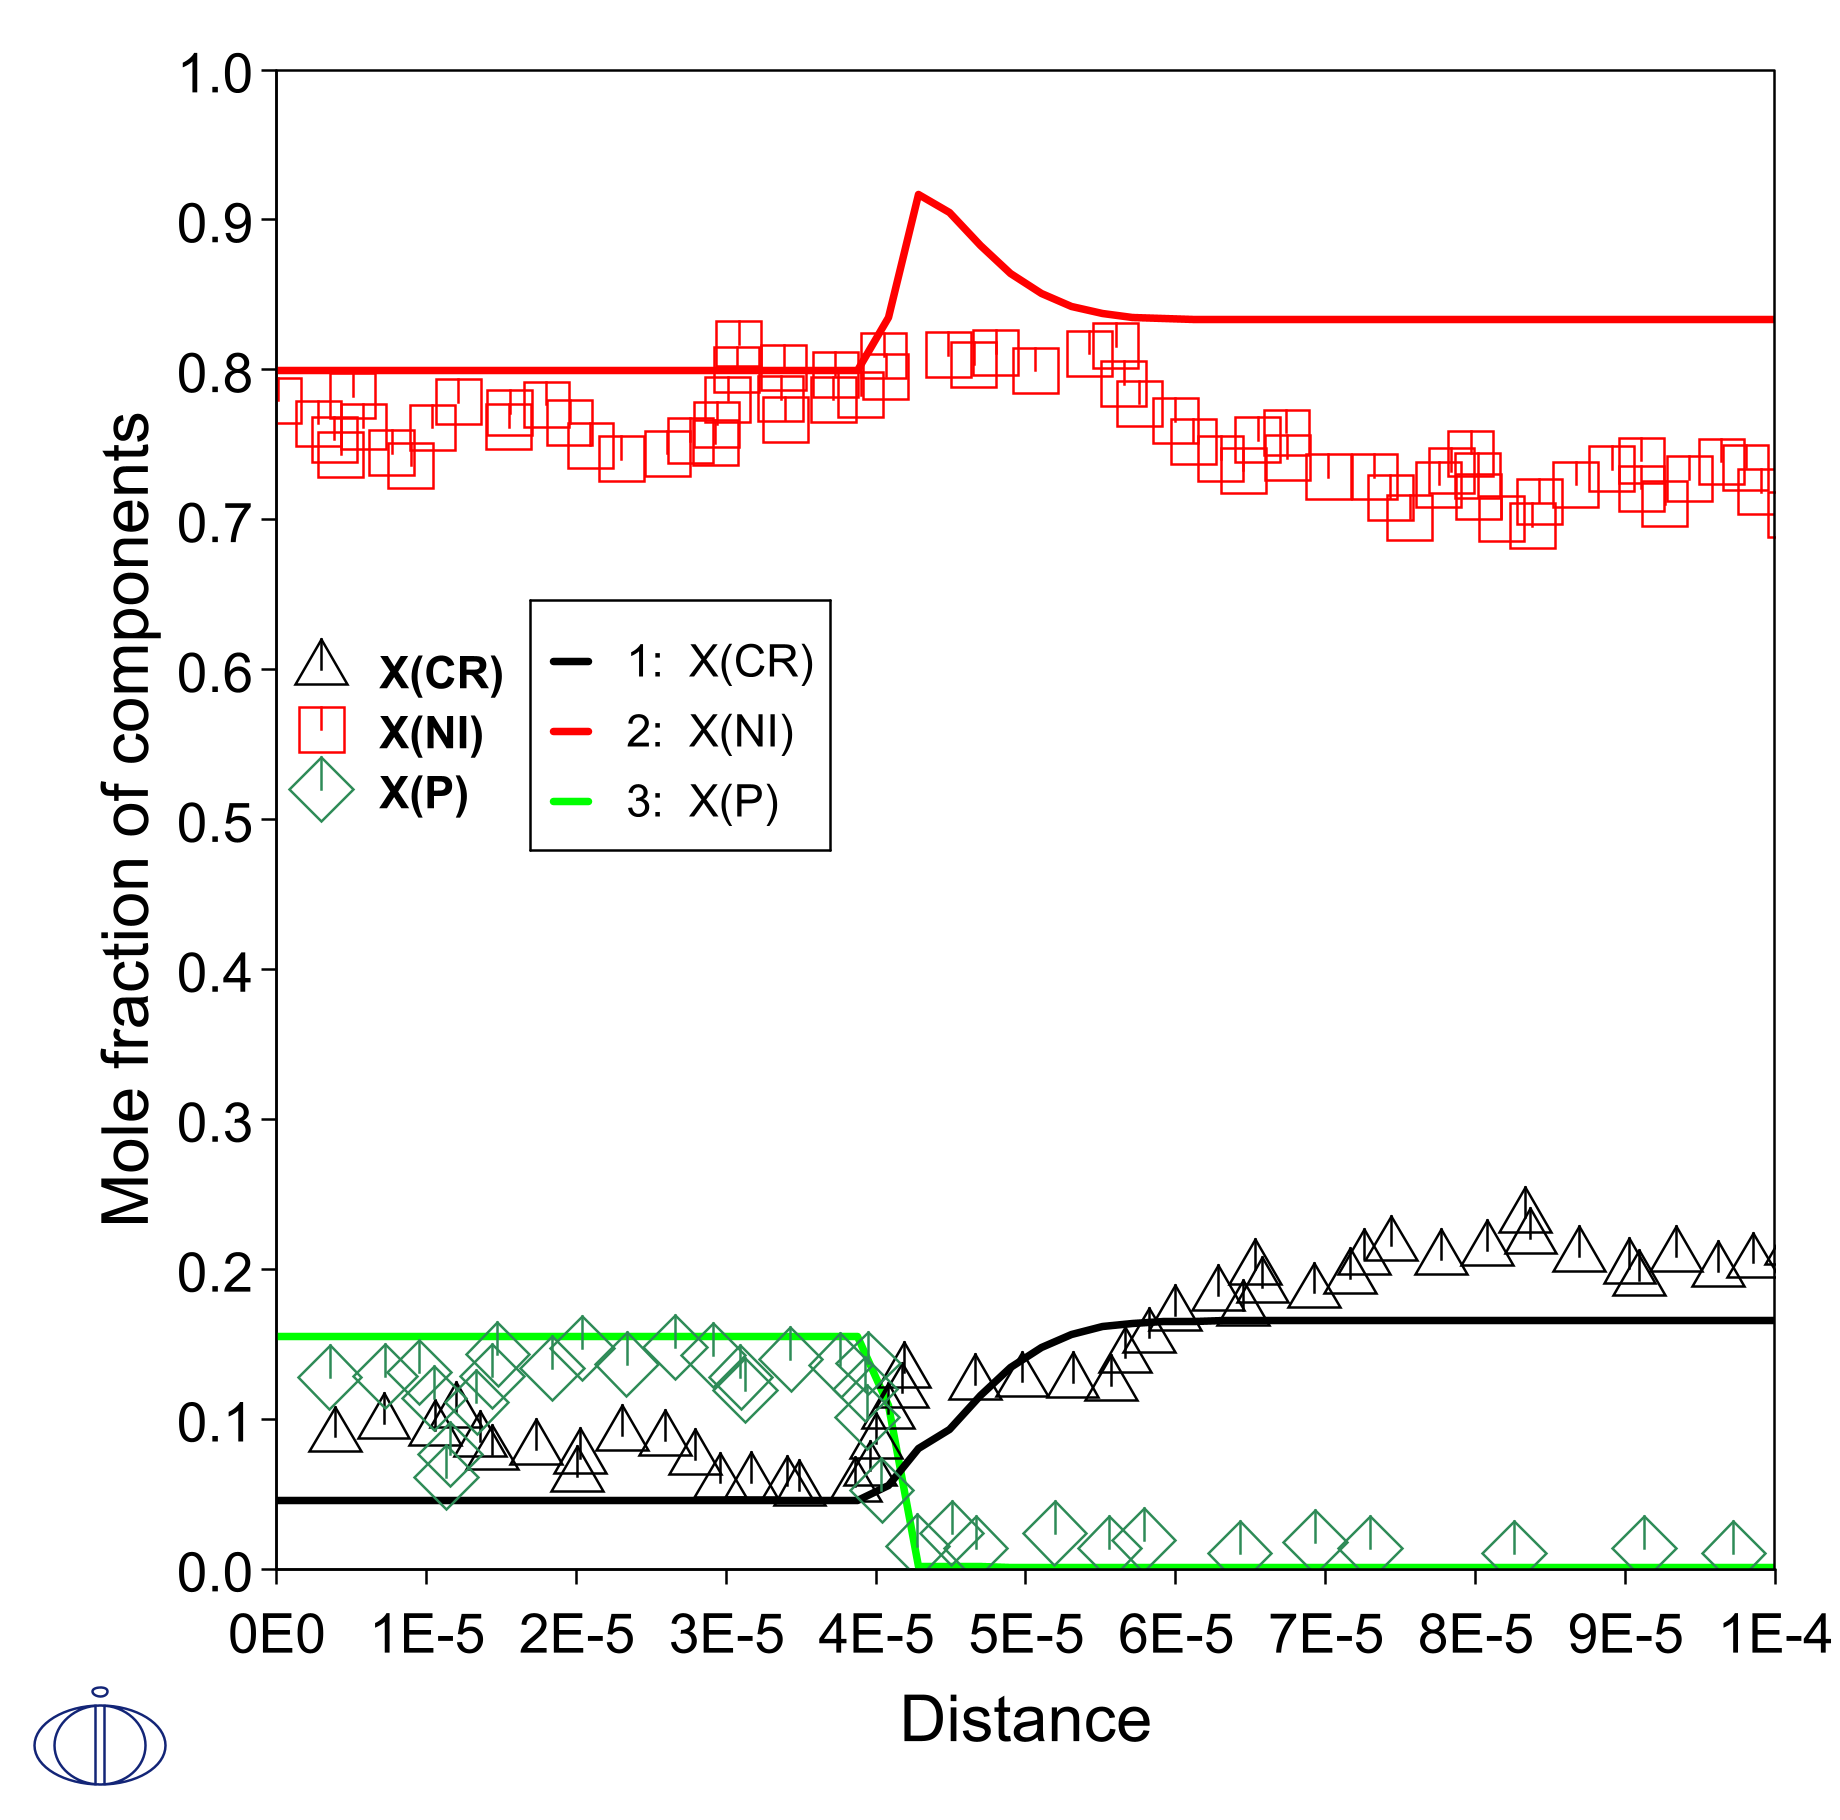
A simplified diffusion simulation of this example, representing GH3039 with Ni-15Cr, results in the composition profiles shown in Figure 2. A brazing at 1050 °C for 20 minutes is simulated.
The experimental data points in Figure 2 are measured on the final microstructure of the joint; effects during solidification affects the data. Moreover, there are discrepancies between the predicted and measured compositions because the simulation excludes some elements.
Figure 2: Final composition profile after simulation of interdiffusion between Ni-11P (left side) and Ni-15Cr (right side). Experimental data from the literature, measured on final microstructure [2021Lv].
Predicting Phase Stability with the Scheil Calculator
In addition to diffusion calculations with the DICTRA module (in Console Mode) or the Diffusion Calculator (in Graphical Mode), you can also add Scheil solidification calculations to further investigate the prediction of phase stability. In Graphical Mode, the Scheil Calculator is used and in Console Mode the Scheil module.
Read more about Scheil Solidification Simulations on our website, including how to select the right model for your simulation. If you are in Thermo‑Calc, press F1 to search the help to learn about using Scheil.
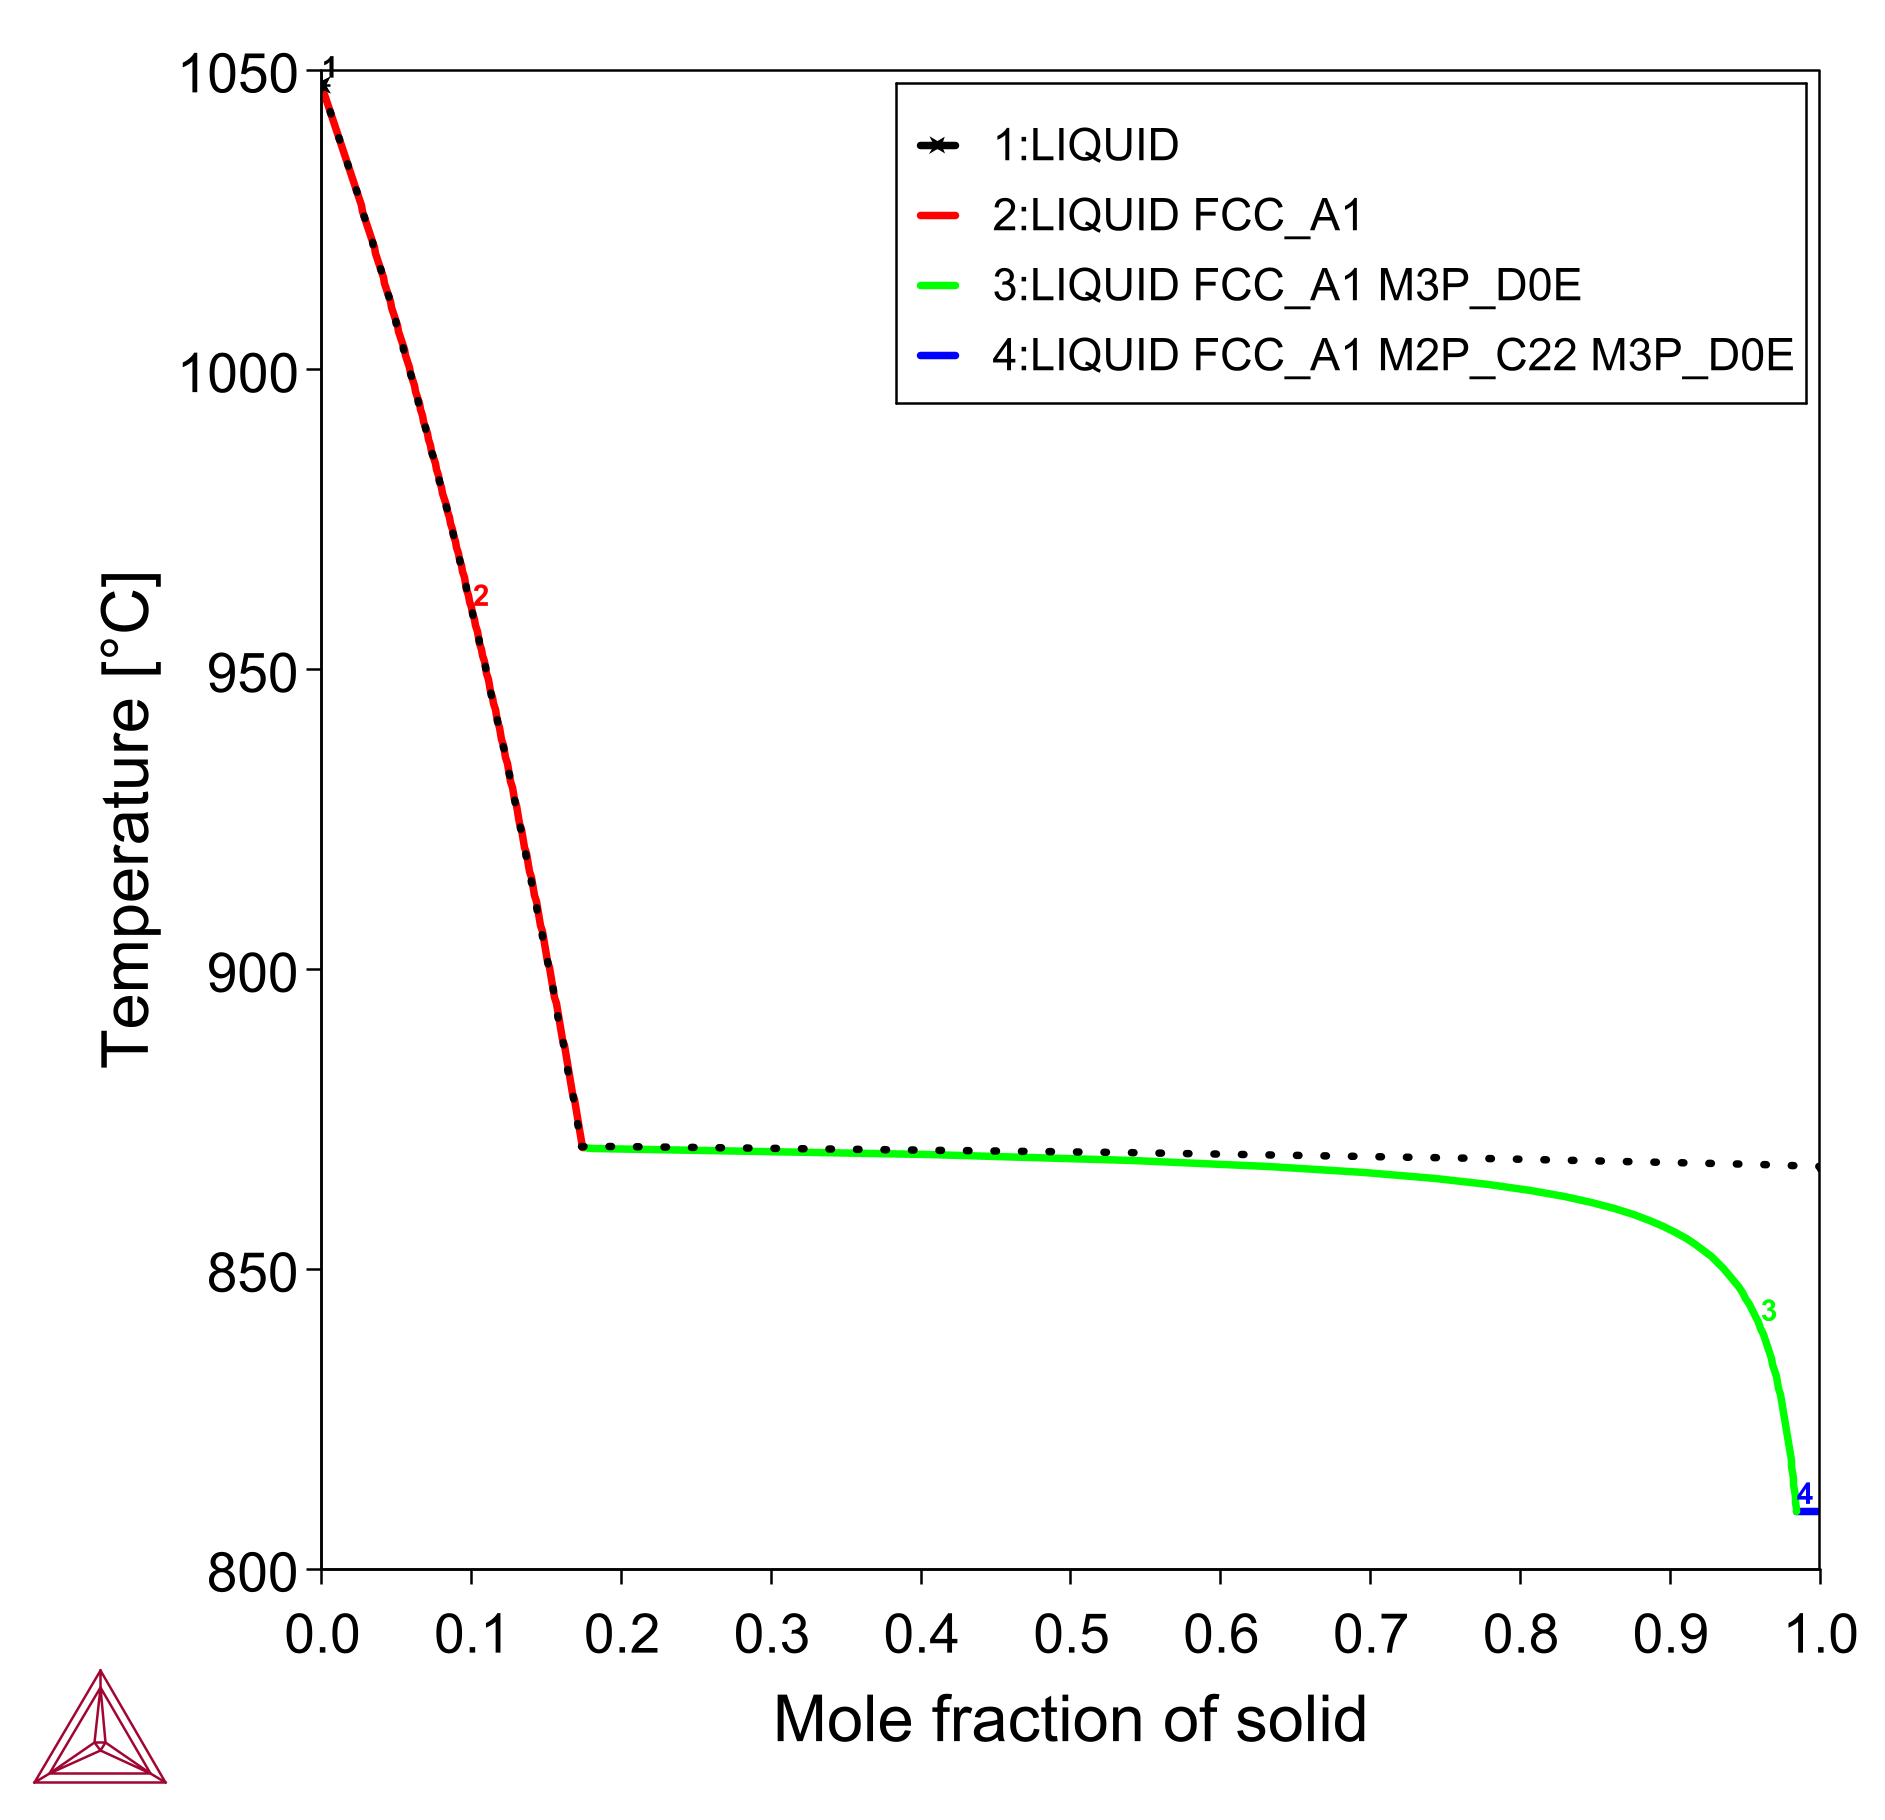
After the diffusion calculations, you can next take the composition in the center of the filler, i.e. a region that is still liquid at the end of brazing, and perform a Scheil solidification simulation to see which phases are predicted to precipitate during rapid cooling of the joint.
After setting up the simulation to use the Scheil Calculator with Thermo-Calc, Figure 3 shows the mole fraction of solid as temperature decreases from 1050 °C. There is a rather slow, primary precipitation of  (FCC_A1) between 1050 °C and 871 °C, after which most of the liquid is rapidly solidified as
  under the eutectic temperature.
This is in good agreement with the general appearance of the phase diagram predicted by the Material to Material Calculator, especially if you look at the right-hand side of Figure 1 where there is some mixing of filler with the parent metal.
Reference
[2021Lv] Y. Lv, K. Han, T. Wang, Effect of brazing temperature on the interfacial microstructure and mechanical properties of GH3039 joint brazed with electroless Ni–P filler metal. Weld. World. 65, 2221–2229 (2021).


