Prediction of Phase Stability
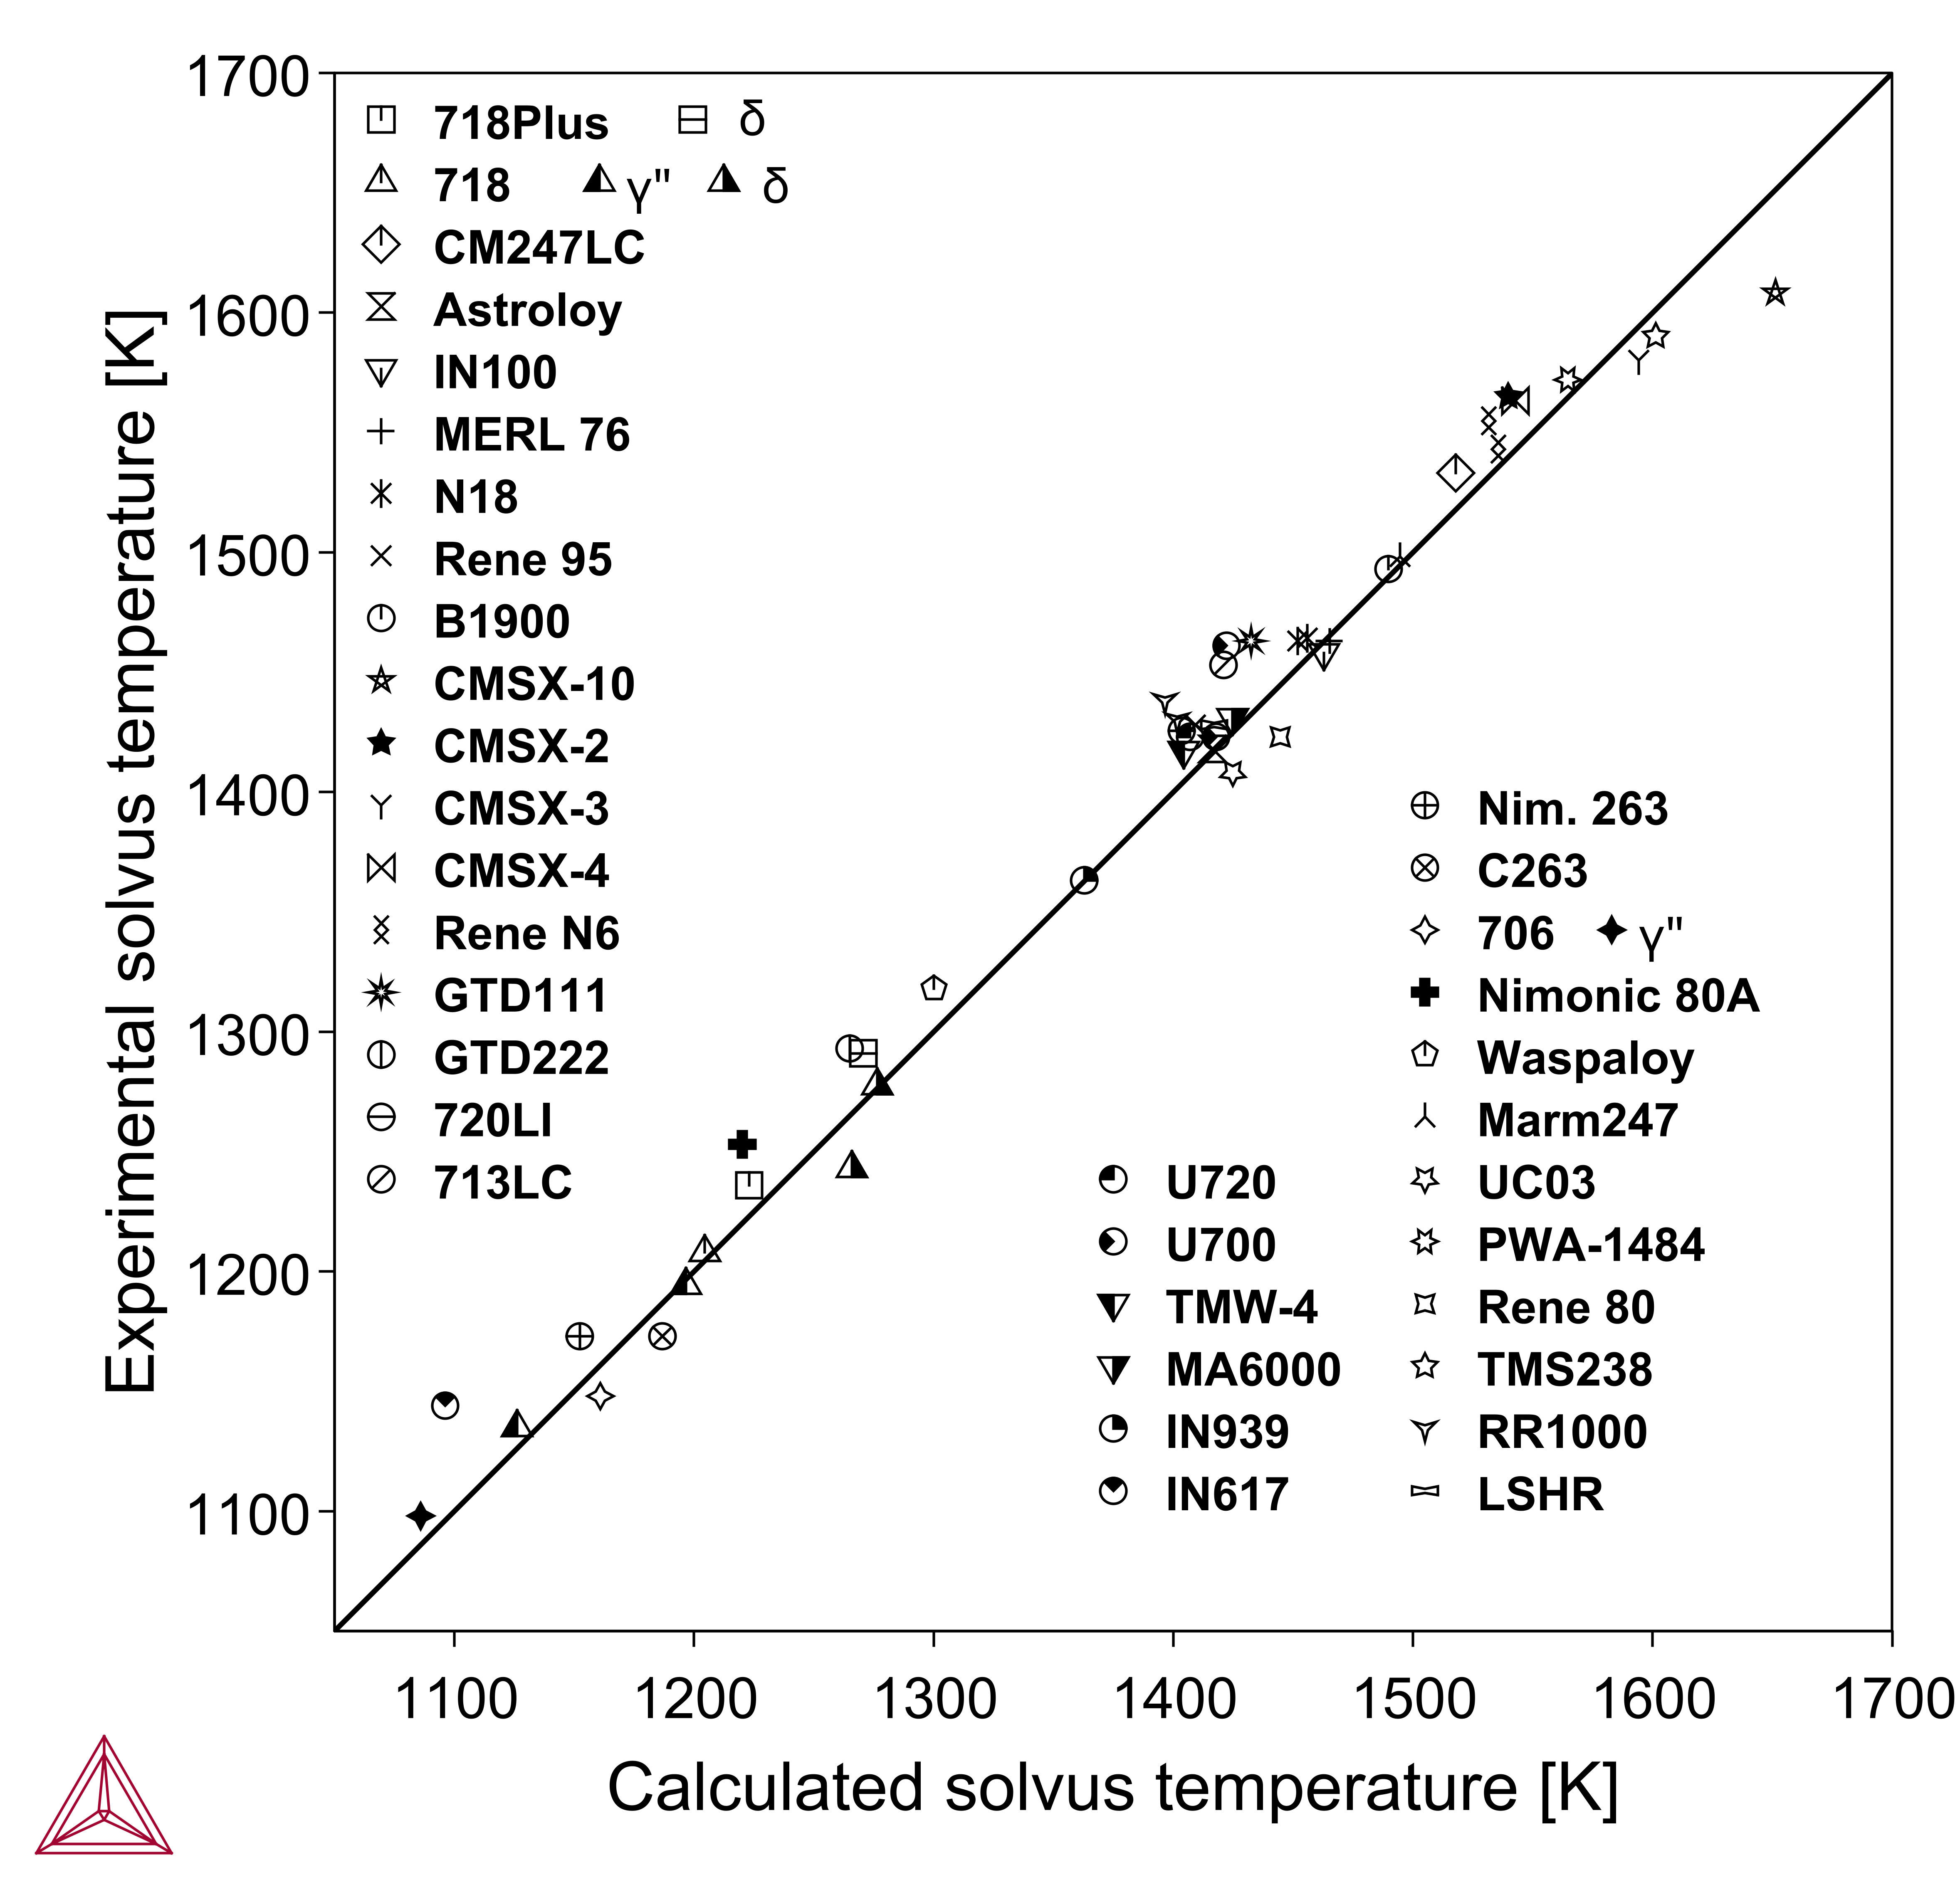
The TCS Ni-based Superalloys Database (TCNI) is routinely validated against industrial alloy data in order to make sure alloys are still well described with each new released database version.
The following example plots represent common usage examples, where the equilibrium and metastable phases present in an alloy are calculated with the variation of temperature.

|

|
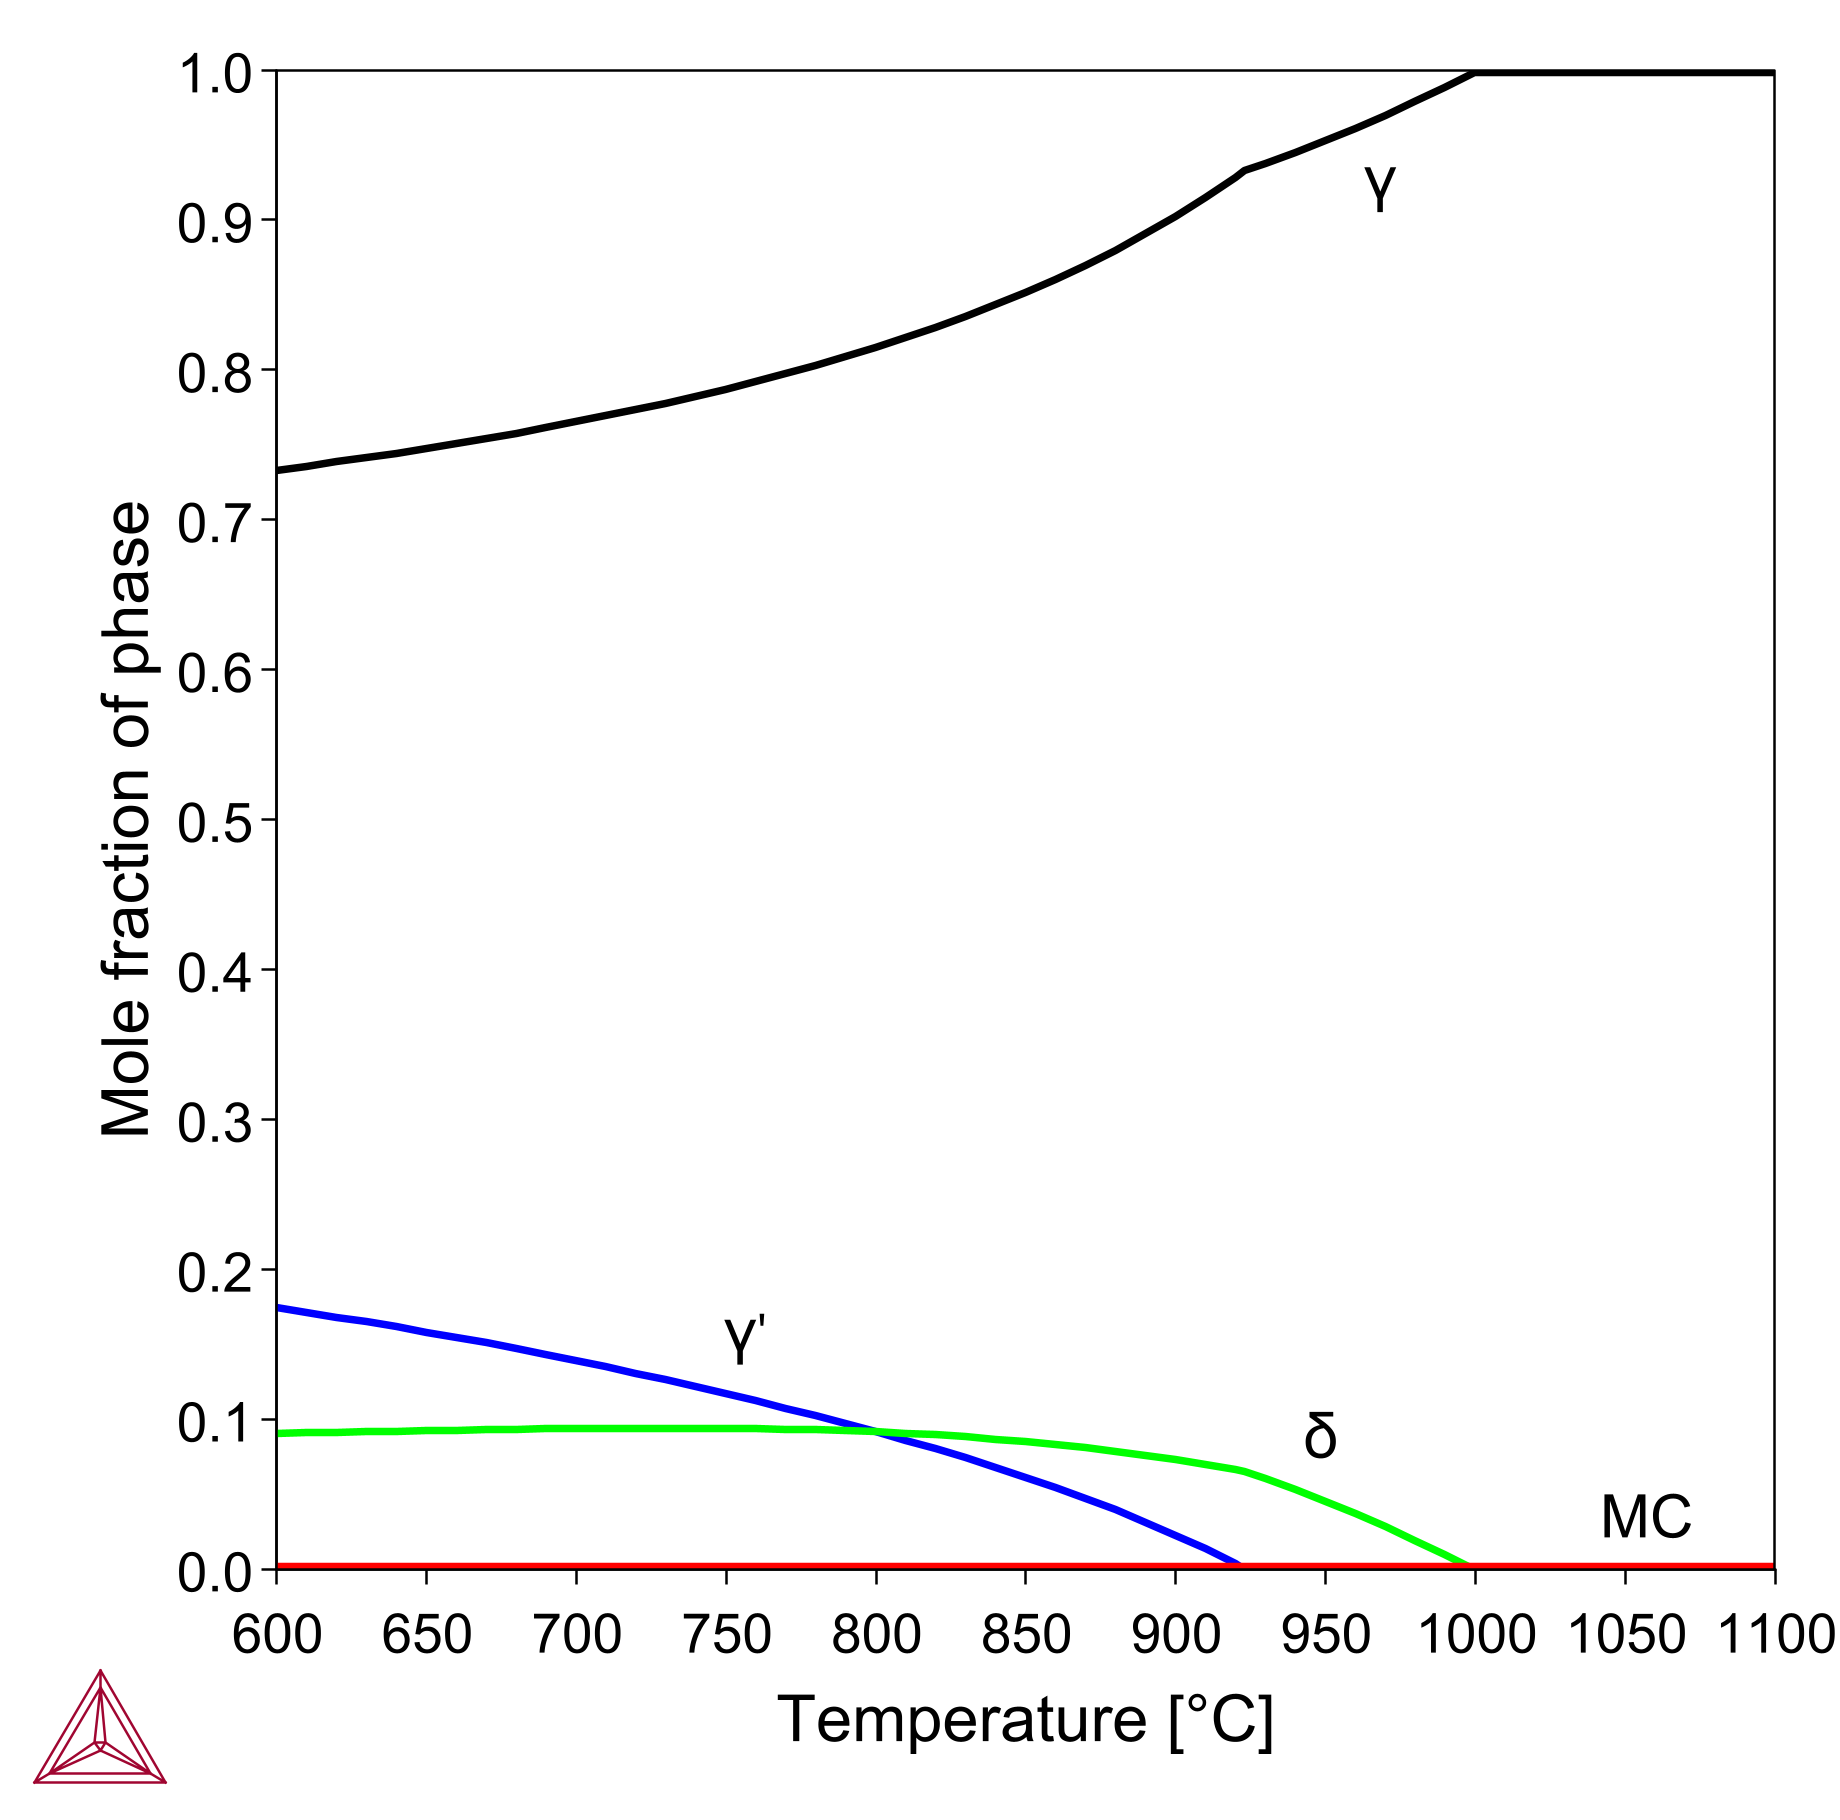
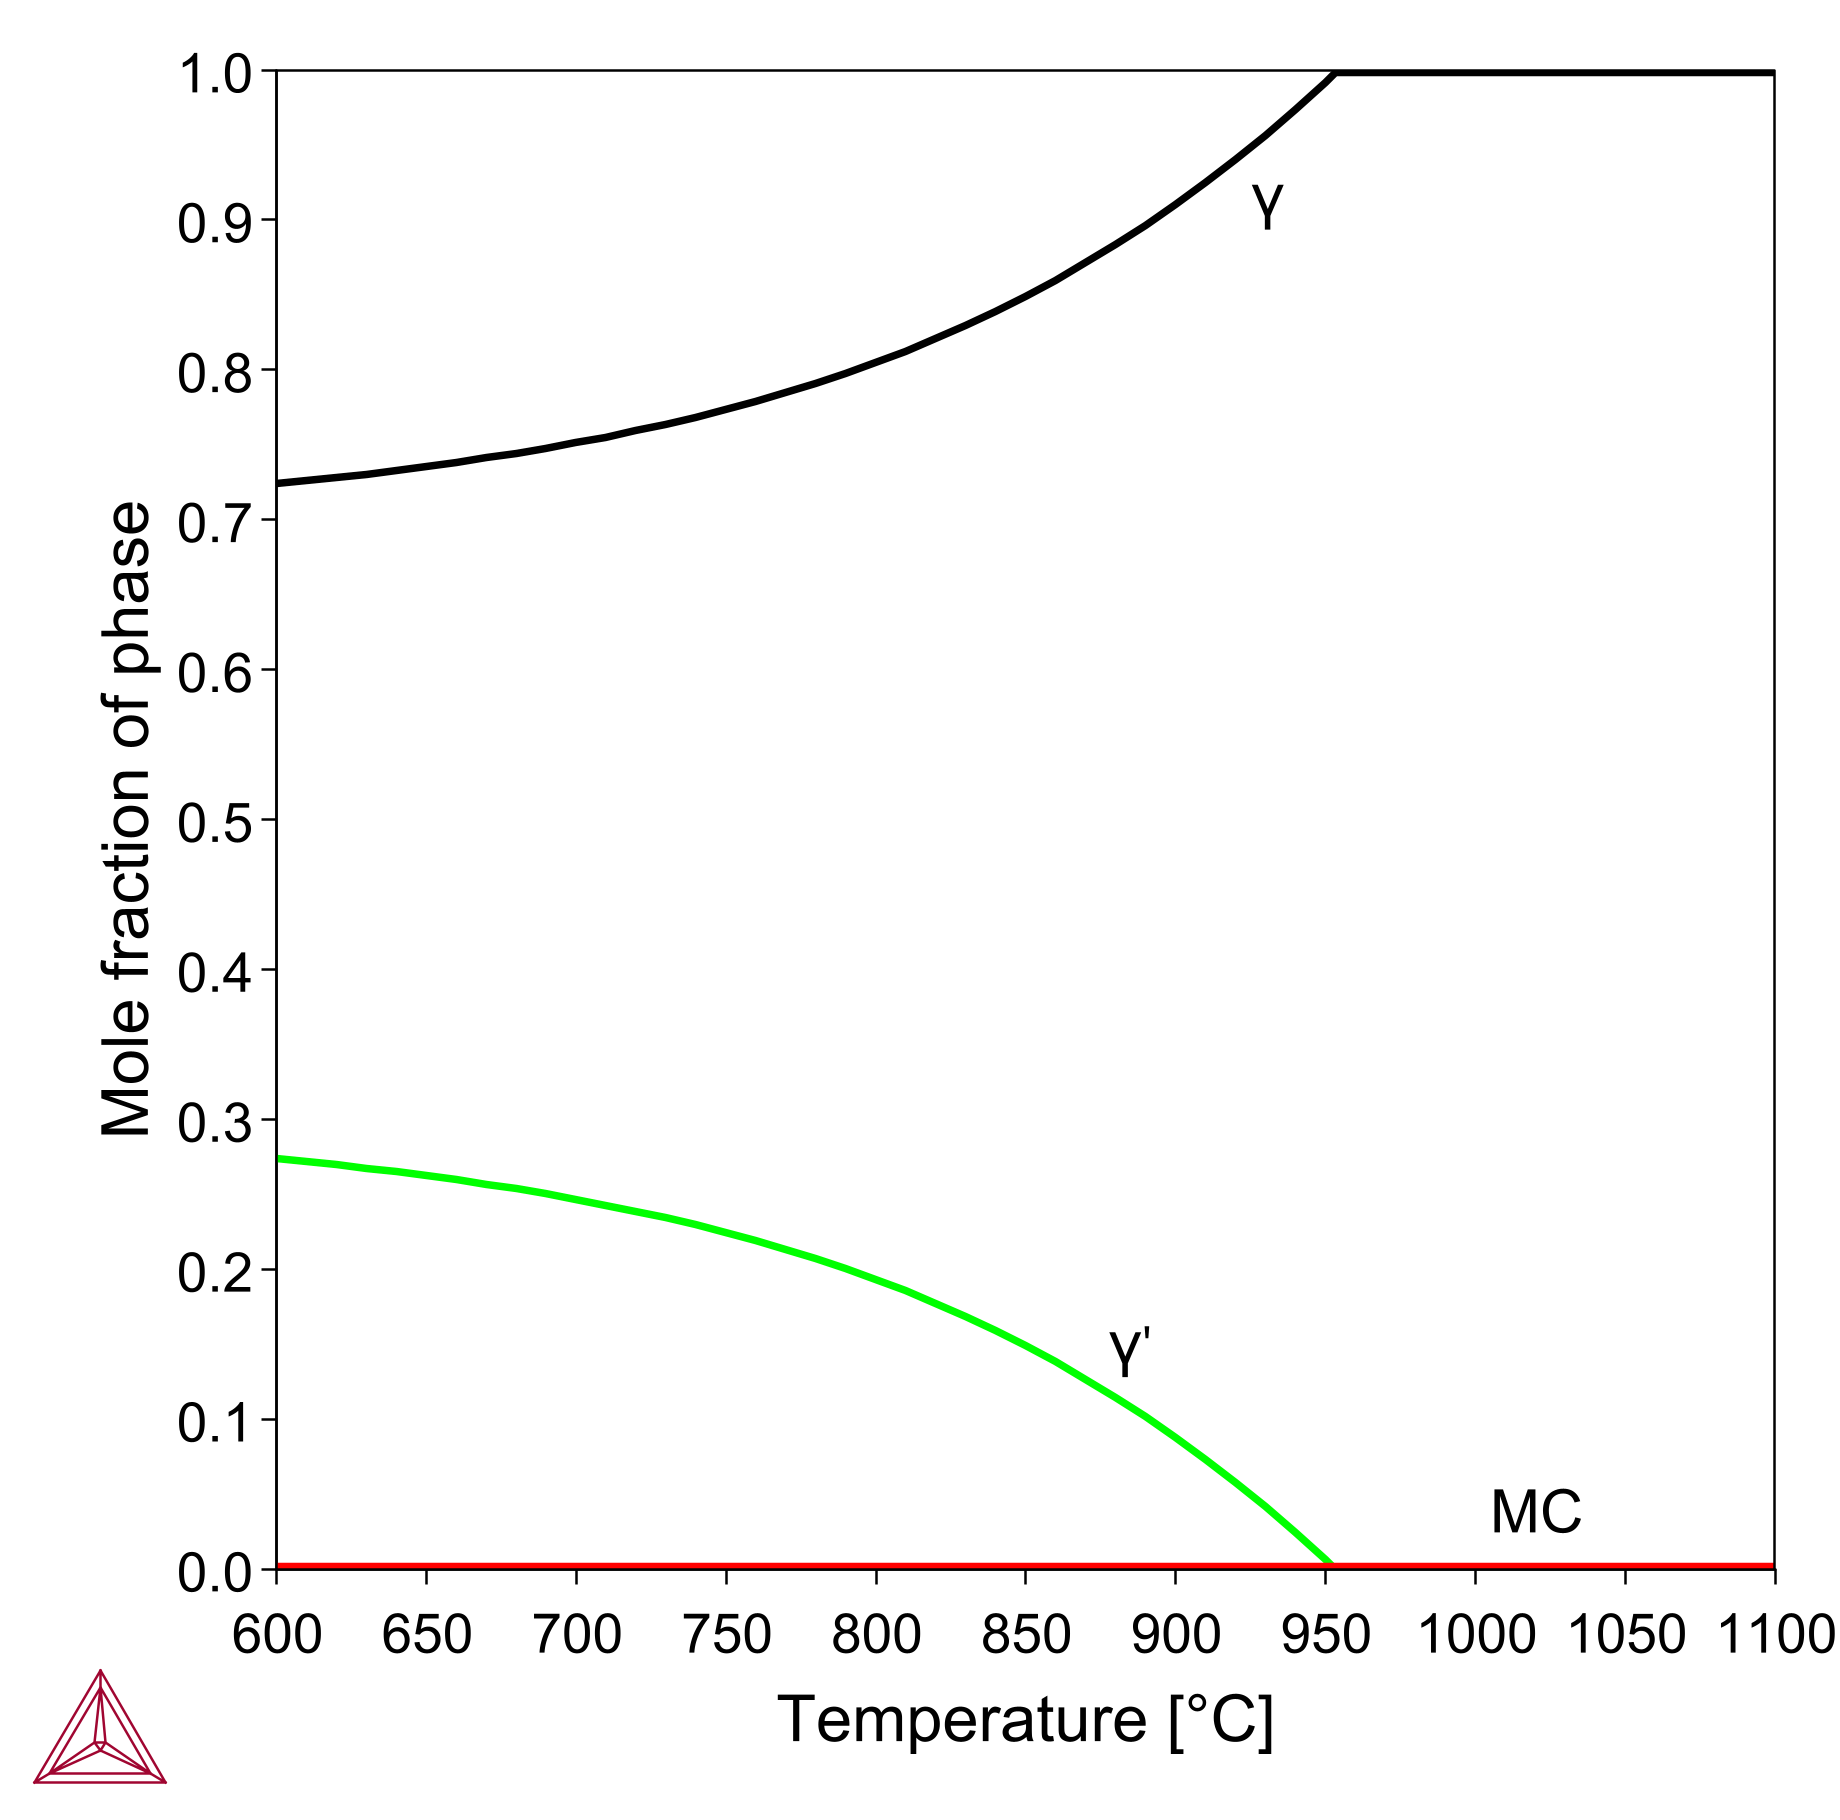
Figure 1: Predicted amount of phases at varying temperatures for a Ni-18Cr-10Fe-9Co-2.8Mo-1.5Al-0.7Ti-5.3Nb-0.02C (wt. %) alloy, (left) stable phases and (right) metastable phases. Delta ( ) phase solvus measured in the range 1000-1020 °C and the metastable γ’ solvus measured at 963 °C.
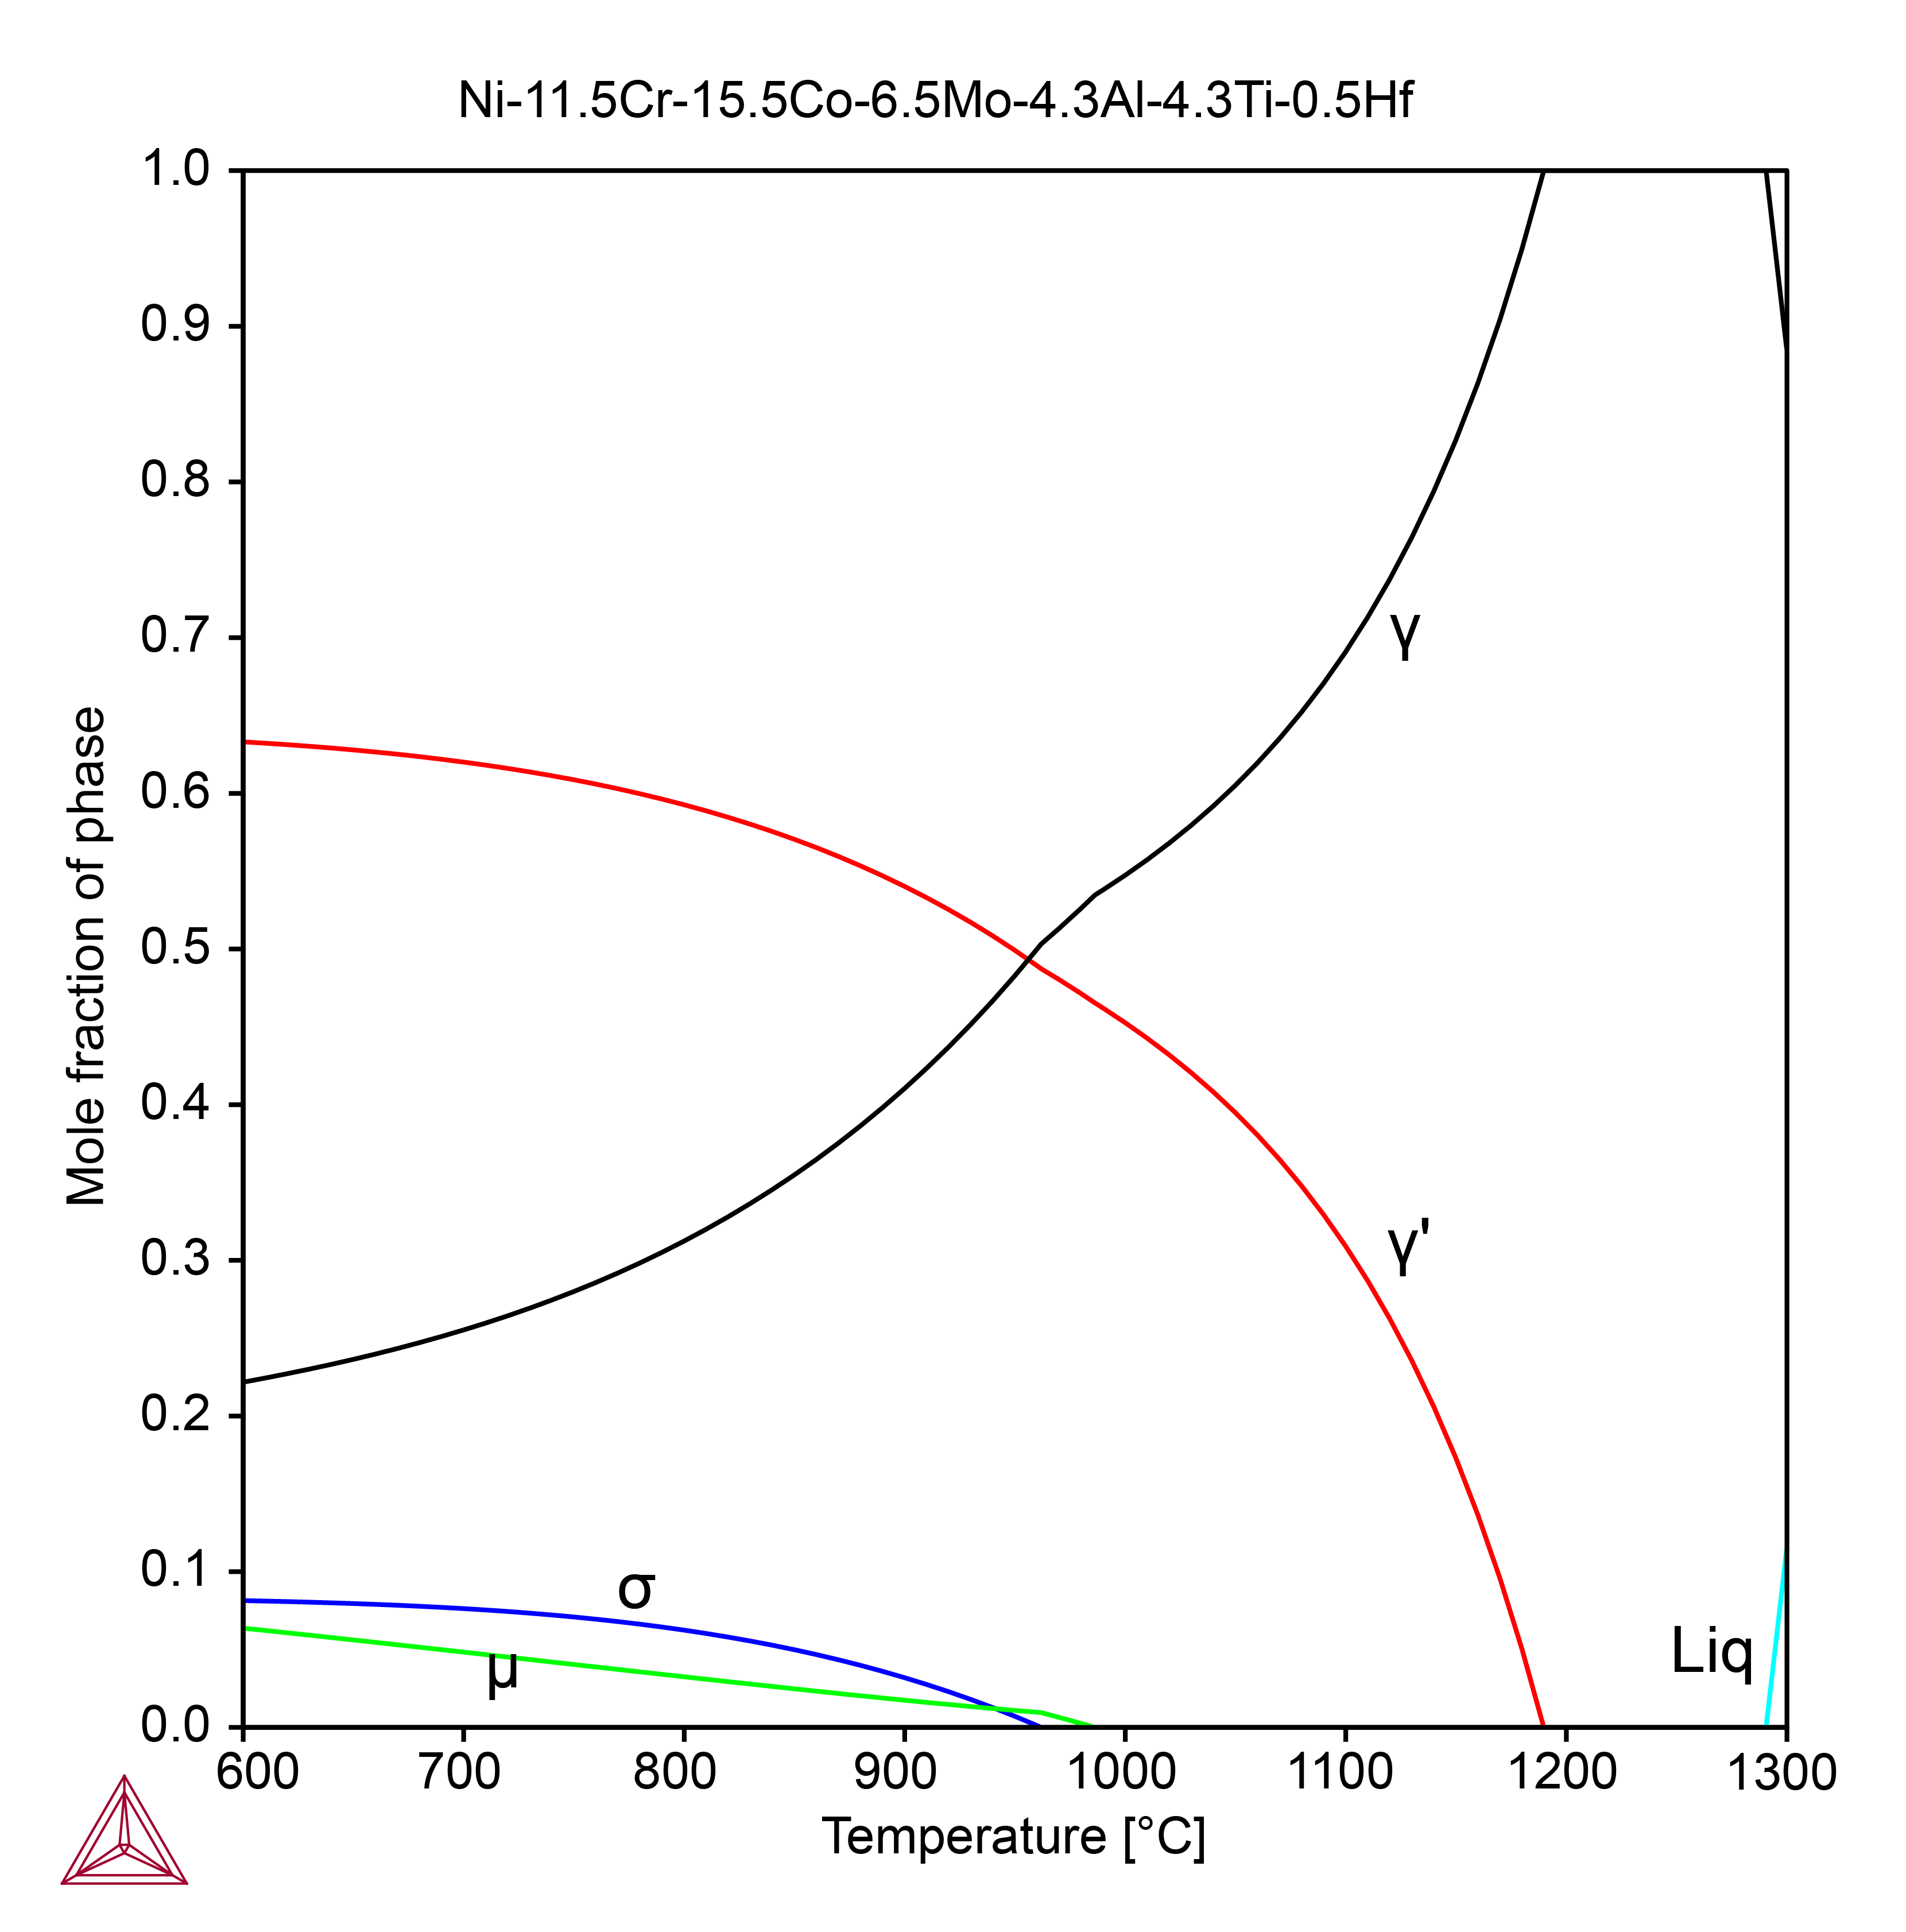
Figure 2: Predicted amount of phases at varying temperatures for a Ni-11.5Cr-15.5Co-6.5Mo-4.3Al-4.3Ti-0.5Hf (wt. %) alloy. Experimental γ’ solvus temperature in the literature is close to 1191 °C and both σ and μ phases were observed at 760 °C after 1000 hours heat treatment.

