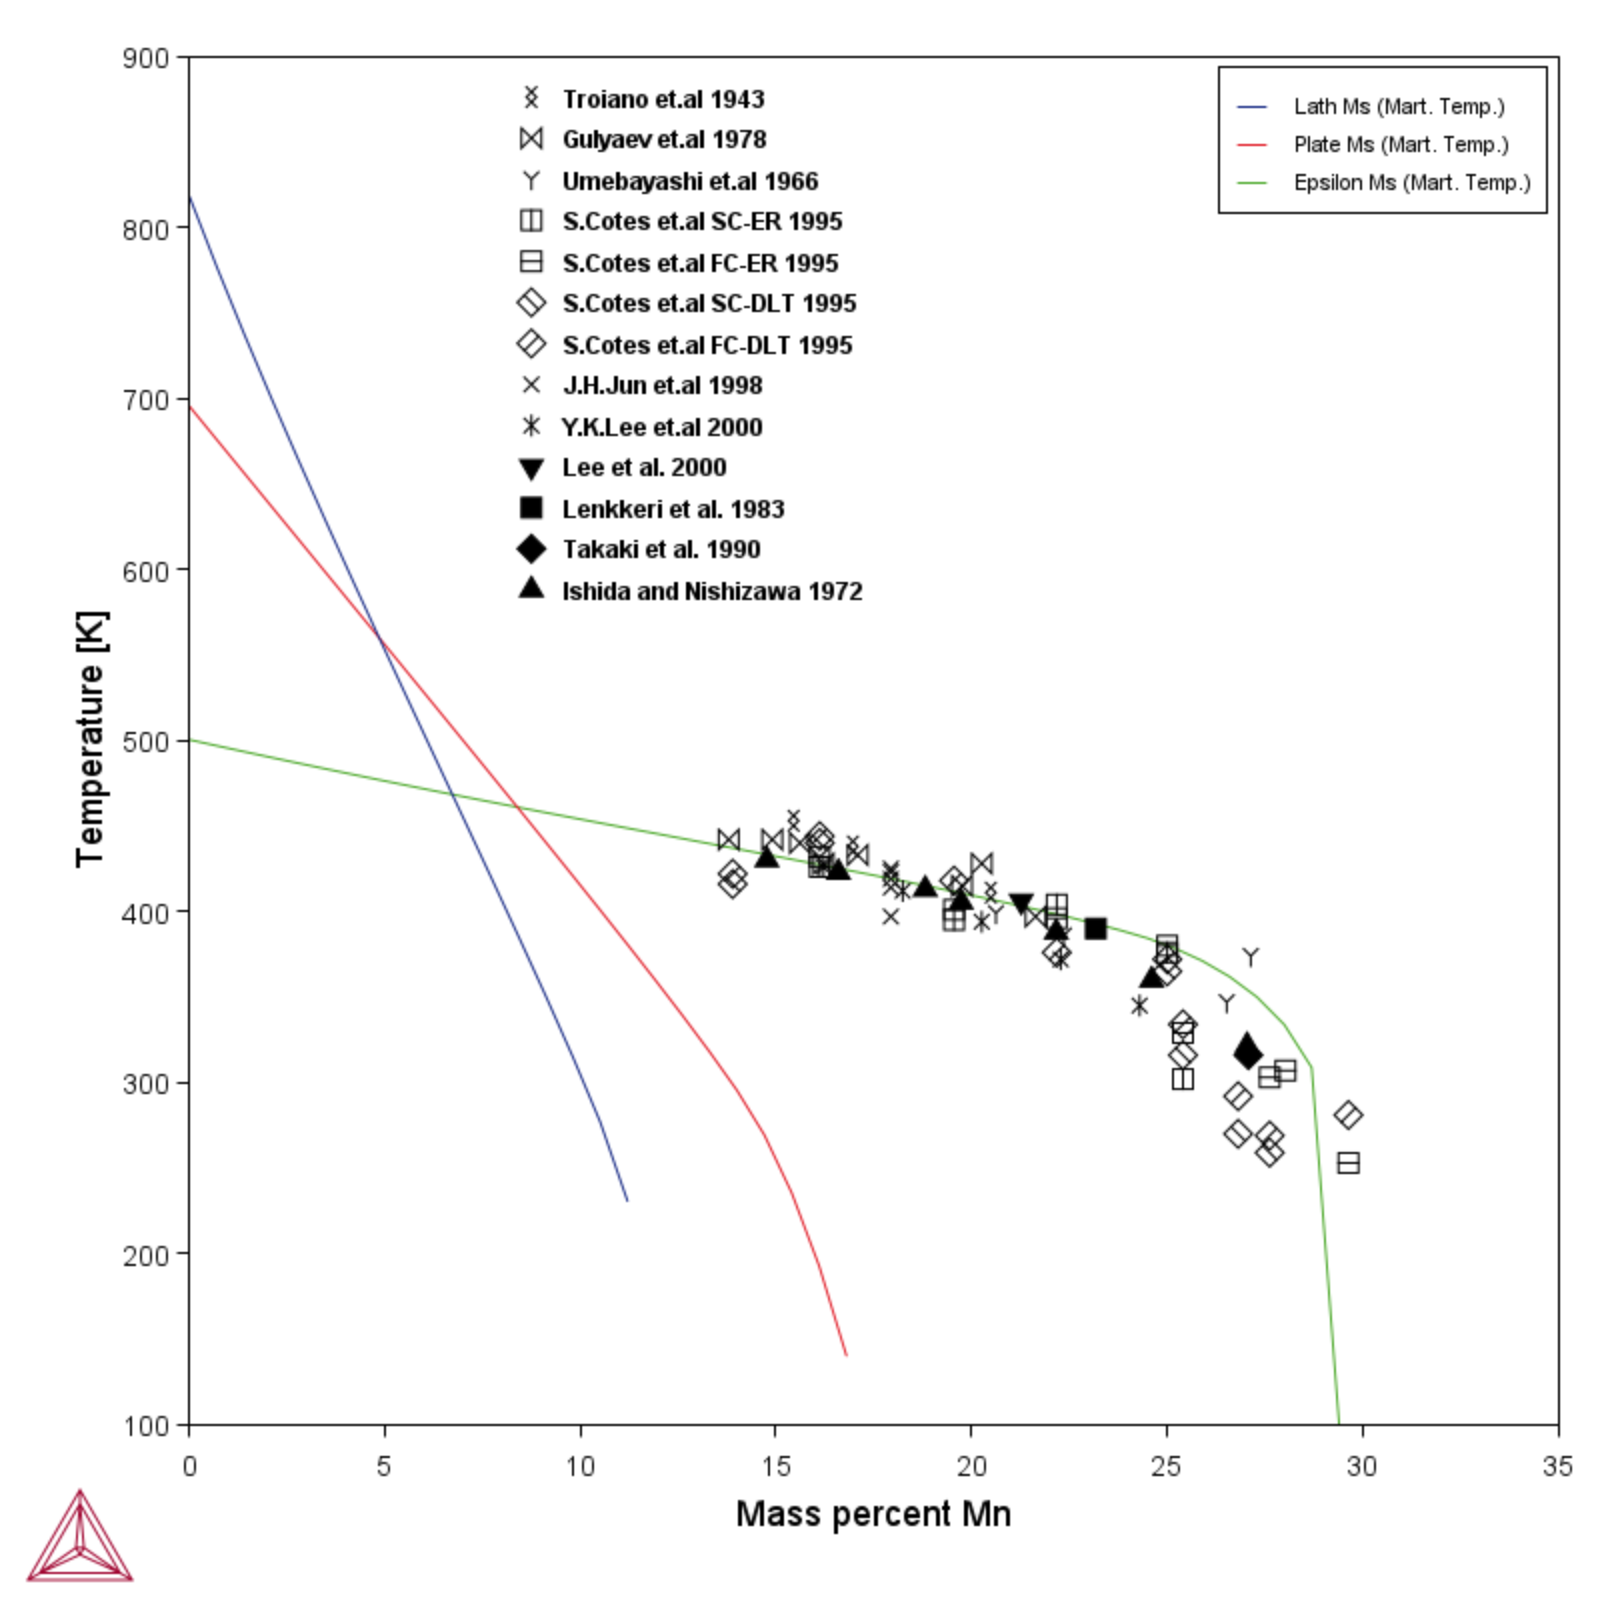
PM_Fe_02: Fe-Mn Martensite Morphologies
The example uses the Property Model Calculator with the Martensite Temperatures Property Model to calculate the Ms temperatures of different types of martensites: lath, plate, and ε (HCP), compared with experimental ε Ms values taken from several sources.
Property Model Calculator and About the Martensite Temperatures Property Model
Visualizations
Many of our Graphical Mode examples have video tutorials, which you can access in a variety of ways. When in Thermo‑Calc, from the menu select Help → Video Tutorials, or from the main My Project window, click Video Tutorials. Alternately, you can go to the website or our YouTube channel.
Open the example project file to review the node setup on the Project window and the associated settings on the Configuration window for each node. For some types of projects, you can also adjust settings on the Plot Renderer Configuration window to preview results before performing the simulation. Click Perform Tree to generate plots and tables to see the results on the Visualizations window.
