PM_Fe_11: Steel Design Using the Parallel Coordinates Plot
The example uses the Property Model Calculator and three Property Models to plot a property diagram and a Parallel coordinates plot for chemistries centered around an Fe1.5Cr2.0Ni0.31C1.0Mn alloy. The Ni, Cr, and C chemistries are varied to understand their influence on some key properties. This can be used to optimize a material chemistry to meet specific design criteria.
A One Axis calculation using the Equilibrium Calculator produces a property diagram to show the equilibrium fractions of the alloy.
A second calculation uses a Grid calculation with the Property Model Calculator and the Driving Force, Martensite Temperatures, and Martensitic Steel Strength models to demonstrate the use of the Parallel coordinates plot type. The driving force model in this example calculates the driving force for Cementite to form at 500 °C (tempering temperature). The driving force gives a good idea of how fine a dispersion of carbides could form. Higher driving force means a finer distribution.
When using a parallel coordinates plot type, you can interpret multidimensional data to compare how different parameters affect each other. In this example this includes the composition of Ni, Cr, and C (each in mass percent), the Driving force per mole, the Total hardness of the tempered steel, and the Ms temperature.
Plot Type: Parallel Coordinates
Visualizations
Many of our Graphical Mode examples have video tutorials, which you can access in a variety of ways. When in Thermo‑Calc, from the menu select Help → Video Tutorials, or from the main My Project window, click Video Tutorials. Alternately, you can go to the website or our YouTube channel.
Open the example project file to review the node setup on the Project window and the associated settings on the Configuration window for each node. For some types of projects, you can also adjust settings on the Plot Renderer Configuration window to preview results before performing the simulation. Click Perform Tree to generate plots and tables to see the results on the Visualizations window.
When you run (Perform) this example, it takes a few minutes for the calculations to complete.
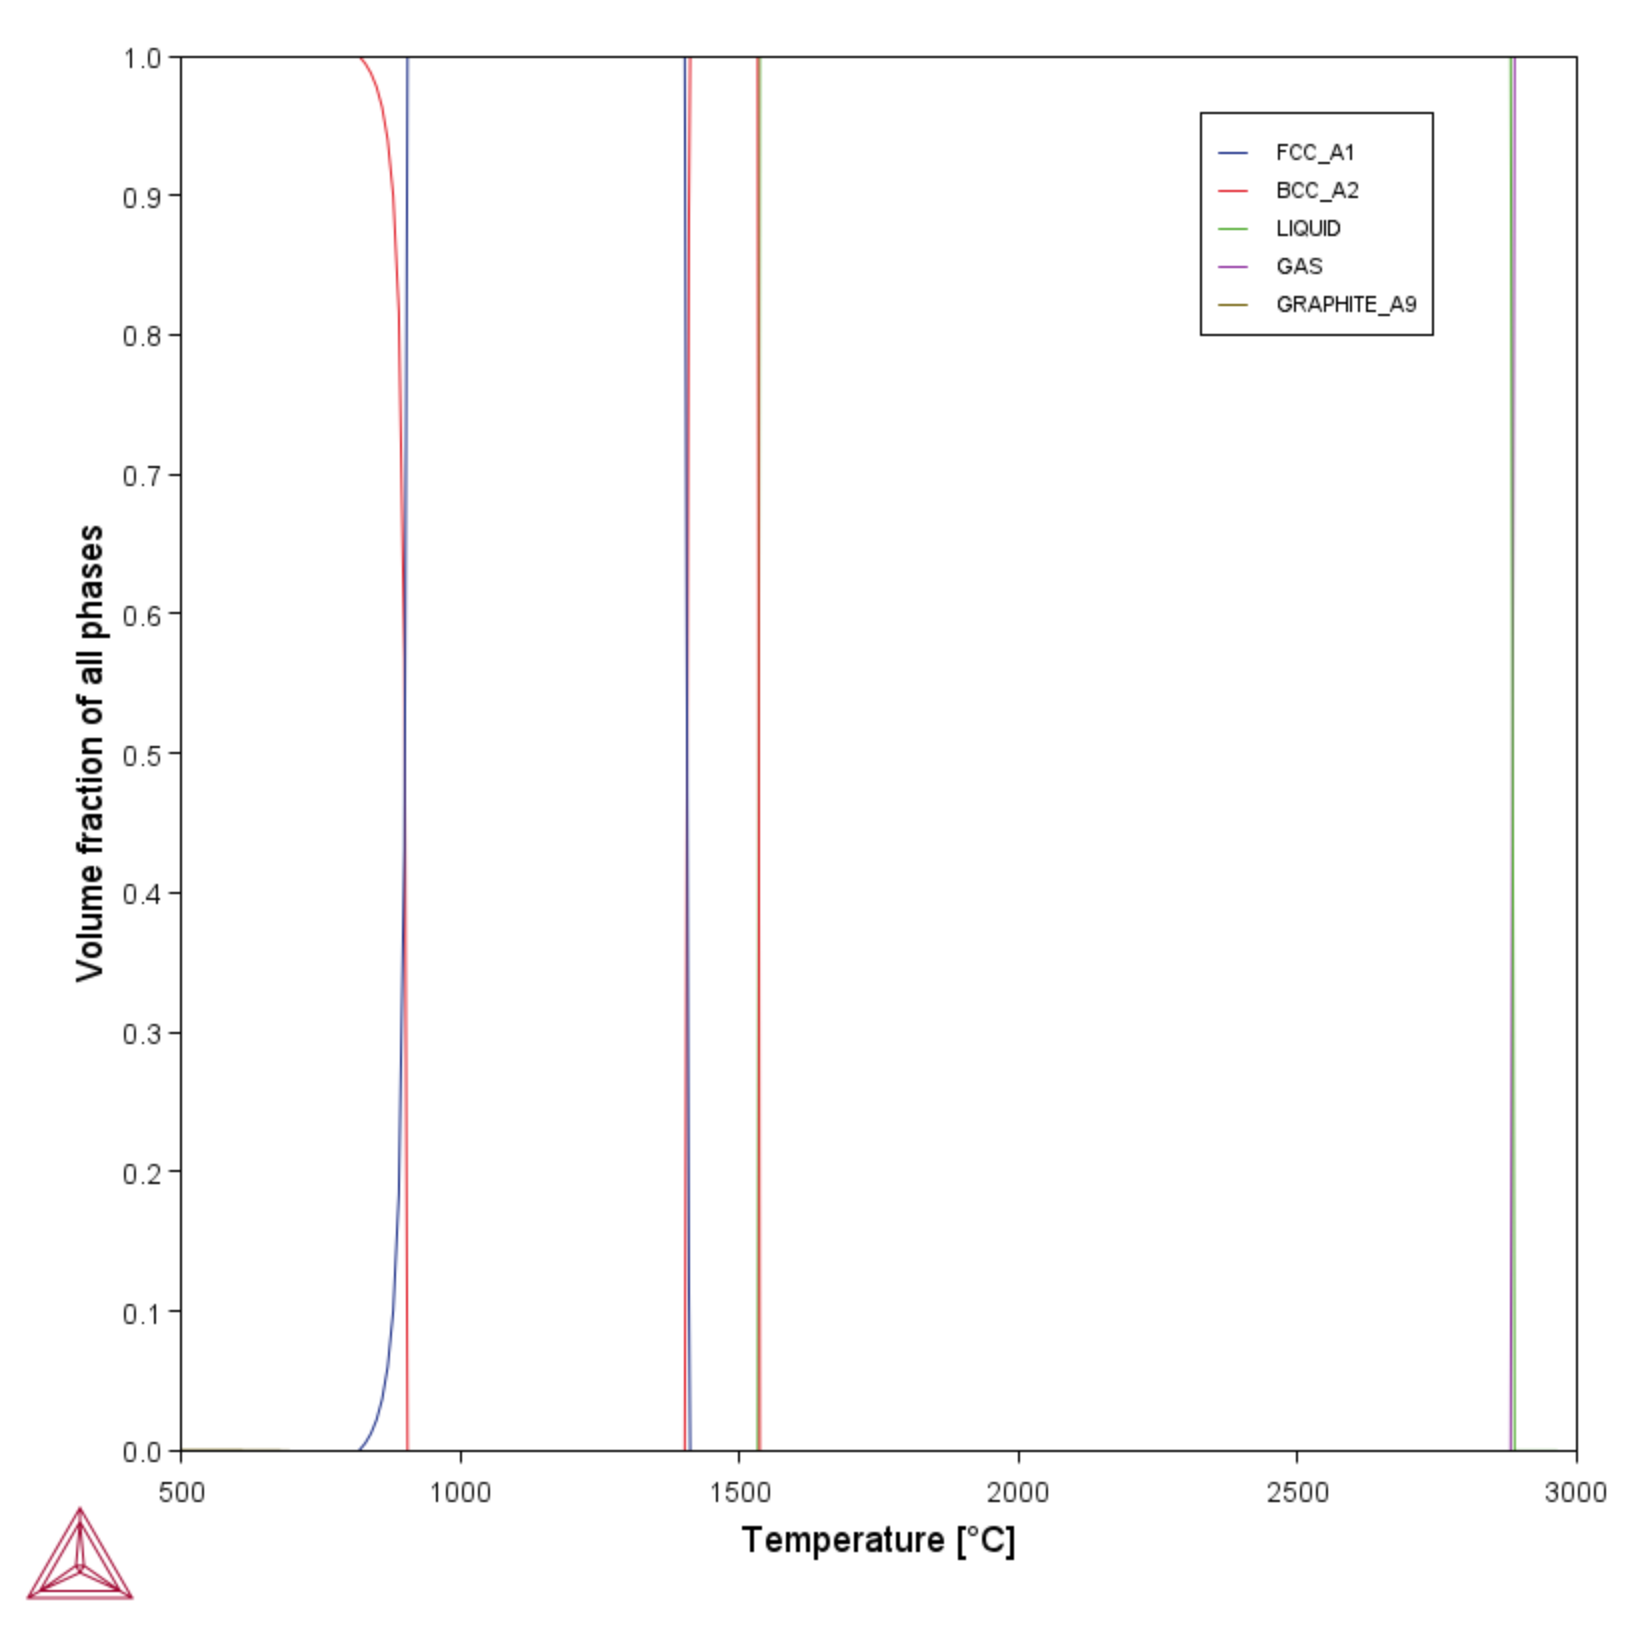
Figure 1: A Property Diagram to observe the change in volume fraction of all phases as the temperature increases.
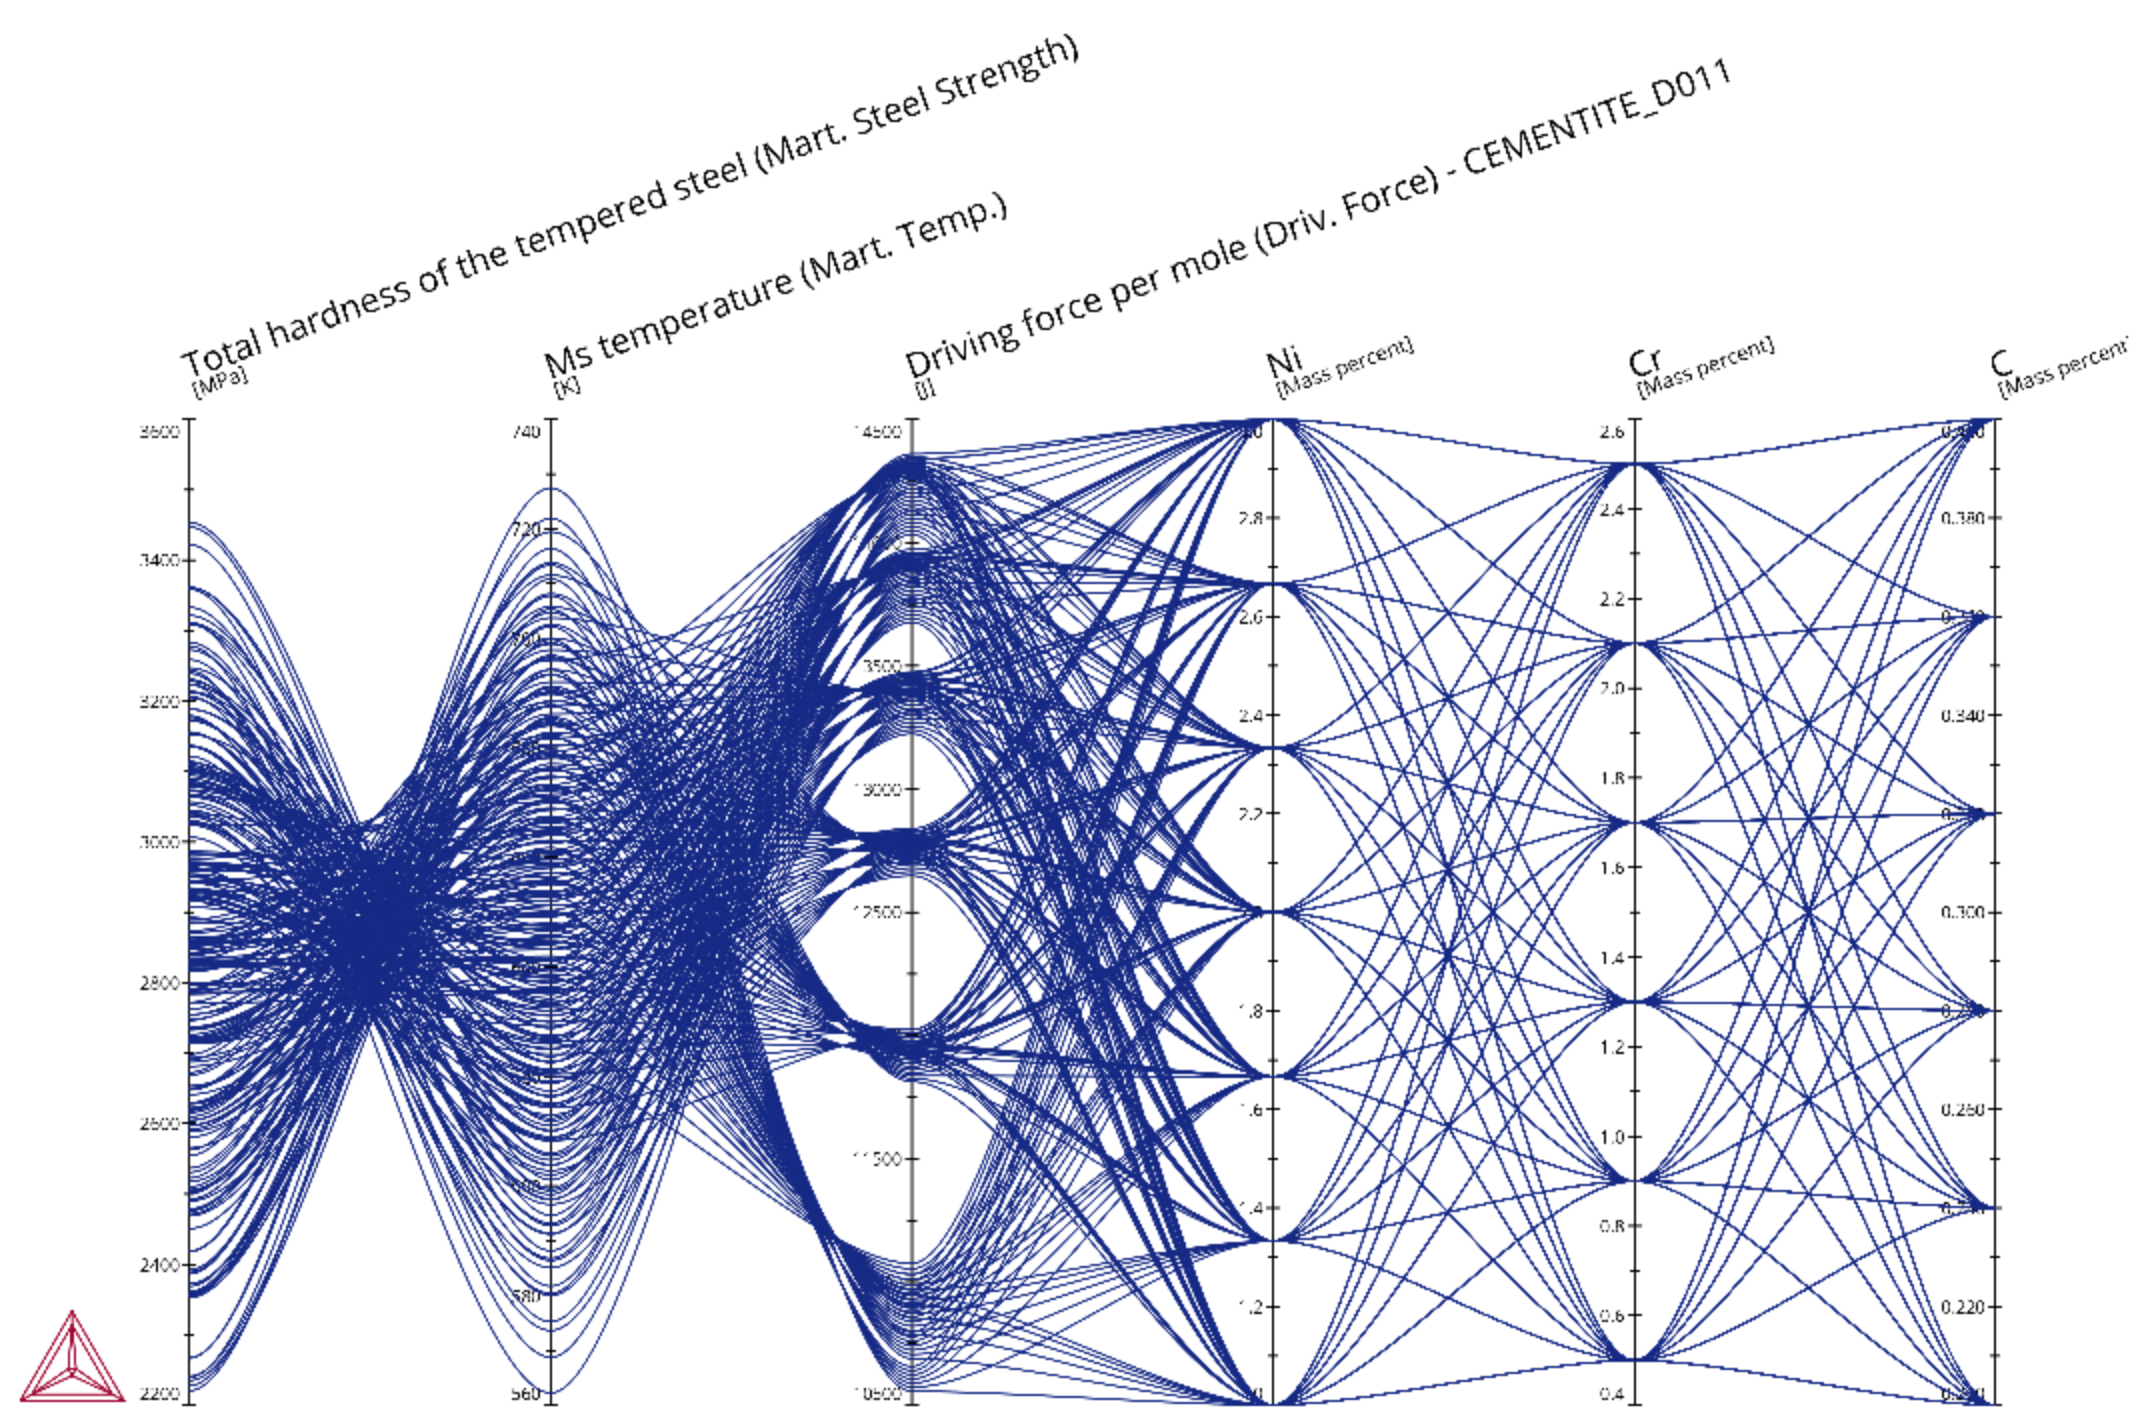
Figure 2: A parallel coordinates plot with multidimensional data comparing the Ni, Cr, and C compositions, the Driving force per mole, the Total hardness of the tempered steel, and the Ms temperature.
Tips to Interpret the Plot Data
- When most lines between two parallel axes are somewhat parallel to each other, there is a positive relationship between these two dimensions.
- When lines cross in a kind of superposition of X-shapes, that is a negative relationship.
- When lines cross randomly it means that there is no particular relationship.