Scheil Calculations Frequently Asked Questions
Below are some frequently asked questions (FAQs) related to Scheil calculations in Thermo-Calc. It is not intended to cover all the scenarios that can occur with such complex calculations. A particular focus is on the use and definition of variables available for plotting latent heat, heat, and apparent heat capacity, and the differences between Graphical Mode and Console Mode.
Latent Heat
Theory usually defines the latent heat as the isothermal enthalpy change of phase transformation at any chosen temperature. It is called latent because it is regarded as a potential heat release or uptake. Usually this is the transformation from liquid to solid.
However, most alloys, if not all, solidify non-isothermally. In the Scheil calculation the plotted quantity called latent heat might not follow the theoretical definition of latent heat. It is the cumulative enthalpy change of phase transformation.
There is no contribution from heat capacity, only from phase transformation.
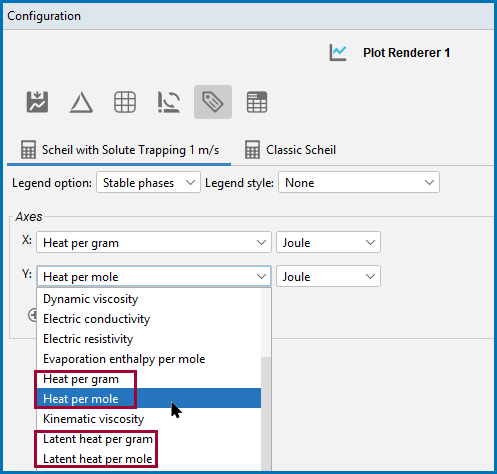
In Graphical Mode, on the
In Console Mode, the corresponding quantities are NHR or BHR. If you plot NH in Console Mode, you get two curves. The bottom curve is NHR, or the latent heat. See State Variables for Scheil for a list of the other variables.
For more detail, see Why in Console Mode are there two curves when plotting heat evolution after a Scheil simulation?
Latent Heat vs Heat
In Graphical Mode, on the
Heat per mole or Heat per gram is the total molar (or specific) enthalpy of the system. This includes both the enthalpy change from phase transformations, and from the temperature change, which comes from the heat capacity.
The following is applicable to Console Mode.
The top curve is the total heat evolution and it is plotted with the quantity NHV. This is the total molar or specific enthalpy, including the contribution from both phase transformations and form heat capacity of the phases. The contribution from the solid phases are averaged.
The bottom curve is the axis quantity and it is plotted with the quantity NHR. This means that this is only the contribution of enthalpy changes from phase transformation from liquid; therefore it starts at 0 at the onset of melting.
Distribution of Component in Phase
In Graphical Mode the axis quantity is called Distribution of component in phase. This gives the distribution of that element as a fraction of the total molar inventory of that element, from 0 to 1 (0 to 100 % of the overall composition). For example, the total amount of Fe in all phases should then sum up to 1.
Be aware that if using the fast diffuser option there may be issues summing up to 1.
In Console Mode, NN(Phase,Element) shows the fraction of this element relative to its total amount in the system, residing in that phase. Here a value of 0.3 means 30 % of all the Fe in the system is in that particular phase.
You can also use wildcards, e.g. NN(Phase,*), which shows all elements’ respective fractions of the total in that phase (this does not sum up to 1). This is useful to get an overview of preferential partitioning of elements during the solidification process.
Also useful is plotting NN(*,Element), where you see the distribution of the element over all phases in the system; these curves should all sum up to 1. Here, 0.3 of Fe in Liquid and 0.7 in FCC, would mean that 30 % of the total Fe-content in this alloy is still in the liquid, etc.
Due to calculation issues when working with fast diffusers, this command is not available in Console Mode.
Apparent Heat Capacity
The apparent heat capacity is what is going to be measured experimentally; heat capacity is theoretically the derivative of enthalpy with respect to temperature. This apparent heat capacity includes both contributions from phase transformation and from temperature change.
For Graphical Mode examples, see T_08: Scheil and Equilibrium Solidification, T_10: Scheil Solidification with Back Diffusion, and T_13: Scheil Solidification with Solute Trapping.
For Console Mode examples see Scheil-Gulliver Examples.
Link to more information about Scheil Solidification Simulations on our website. There are also video tutorials related to some Scheil examples as part of a playlist on our YouTube channel and an application example using the Diffusion Module (DICTRA).
The Thermo-Calc Learning Hub has a module dedicated to Scheil Calculations.
Learn about Thermo-Calc and the Add-on Modules at your own pace with our comprehensive online Learning Hub. The Learning Hub includes courses for Thermo-Calc, the Diffusion Module (DICTRA), the Precipitation Module (TC-PRISMA), and the TC-Python SDK. In addition to introductory lectures, instructors walk through and discuss real world examples that correlate calculations with microstructures and other metallurgical concepts, spanning a wide range of material types.
Subscriptions also include access to live monthly office hours, where you can ask our experts about any of the content on the Learning Hub or your own materials challenges.
