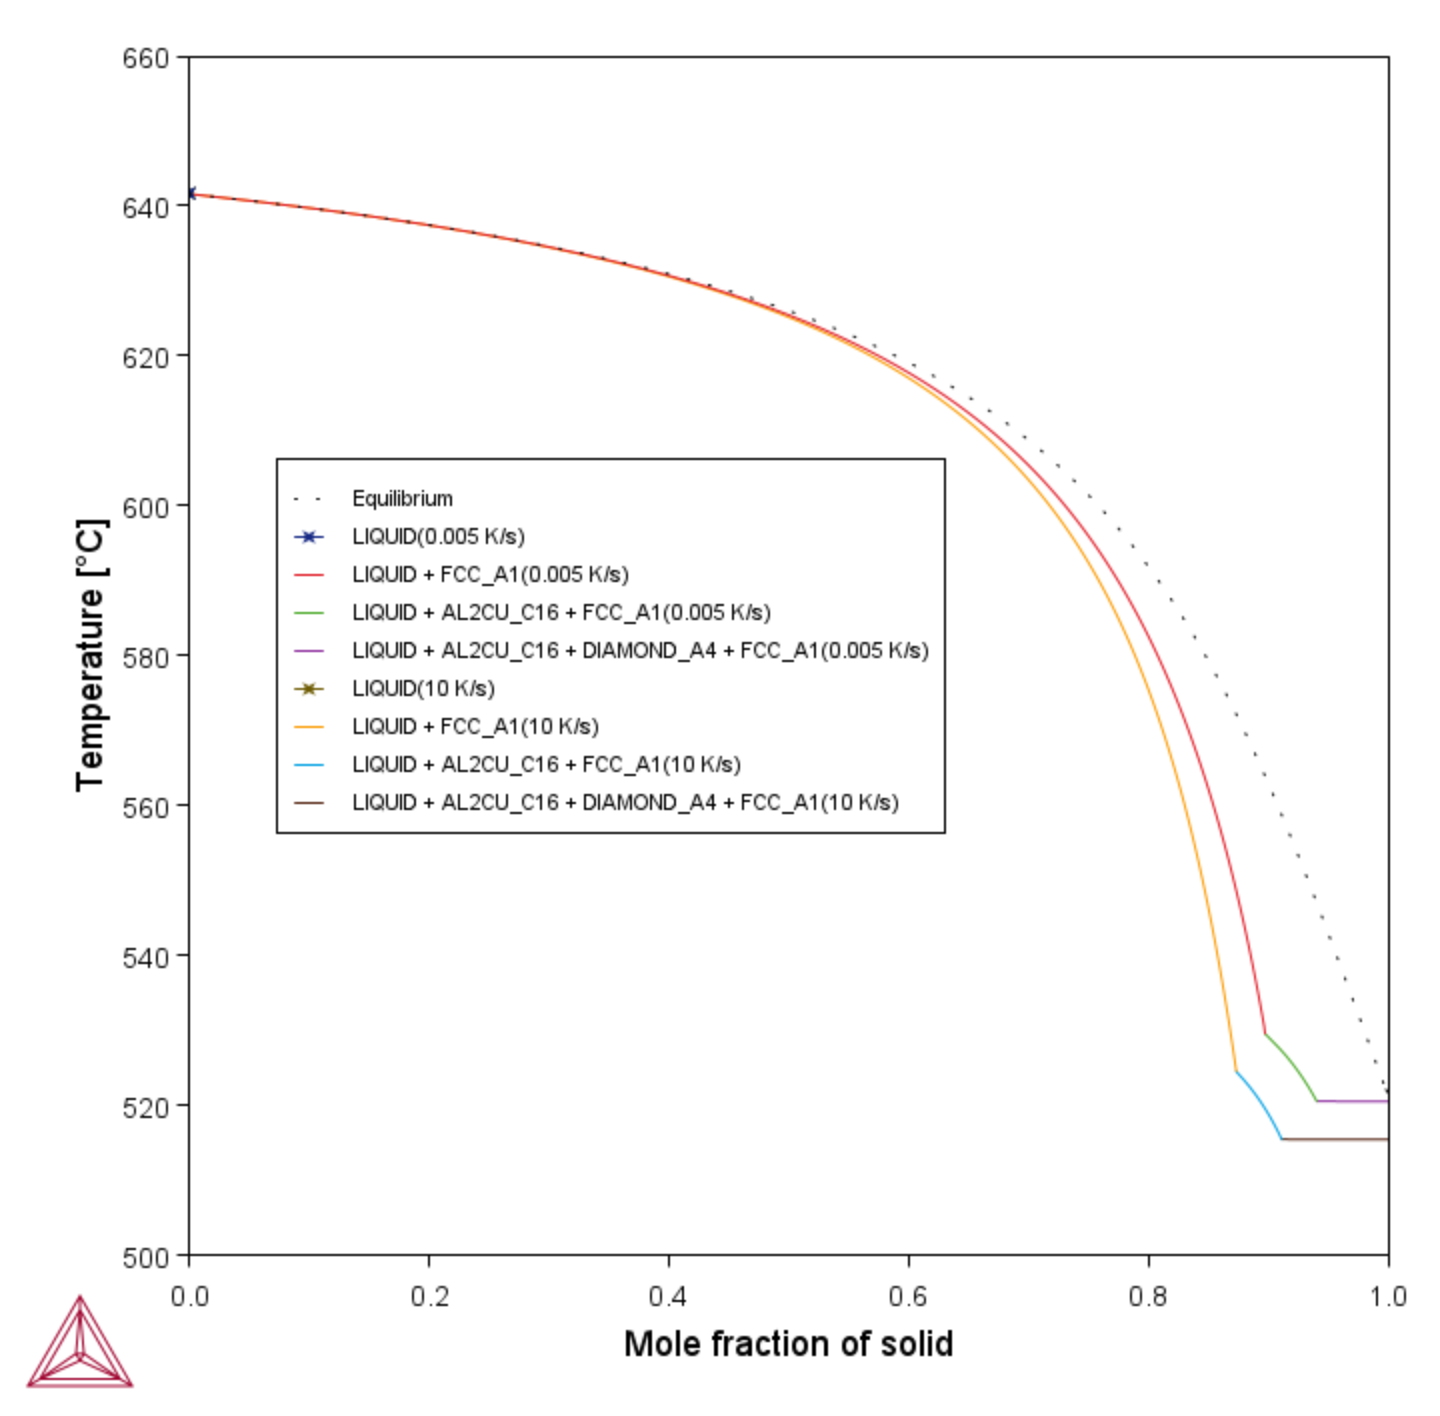
T_10: Scheil Solidification with Back Diffusion
This is an example of a Scheil solidification simulation of a Al-2.1Cu-1Si alloy including back diffusion in the primary phase.
The example uses two of the Scheil Calculator activity nodes with different cooling rates, 10 K/s and 0.005 K/s. The lower cooling rate produces a solidification curve that is closer to the equilibrium curve as shown in the plot result. Both a thermodynamic ALDEMO (aluminum demo) and mobility MALDEMO (Al-alloys mobility) database are used for this calculation.
See Scheil Calculator for an overview of the different Scheil simulation models available.
- Folder: Thermo‑Calc
- File name: T_10_Scheil_with_back_diffusion.tcu
The Scheil with back diffusion feature is only available for systems with diffusion data, i.e. this model requires the use of a mobility database.
Running the example itself does not require an additional license.
Visualizations
This example is included as a tutorial on our website and as part of the Scheil Solidification Simulations playlist on our YouTube channel.
Open the example project file to review the node setup on the Project window and the associated settings on the Configuration window for each node. For some types of projects, you can also adjust settings on the Plot Renderer Configuration window to preview results before performing the simulation. Click Perform Tree to generate plots and tables to see the results on the Visualizations window.
