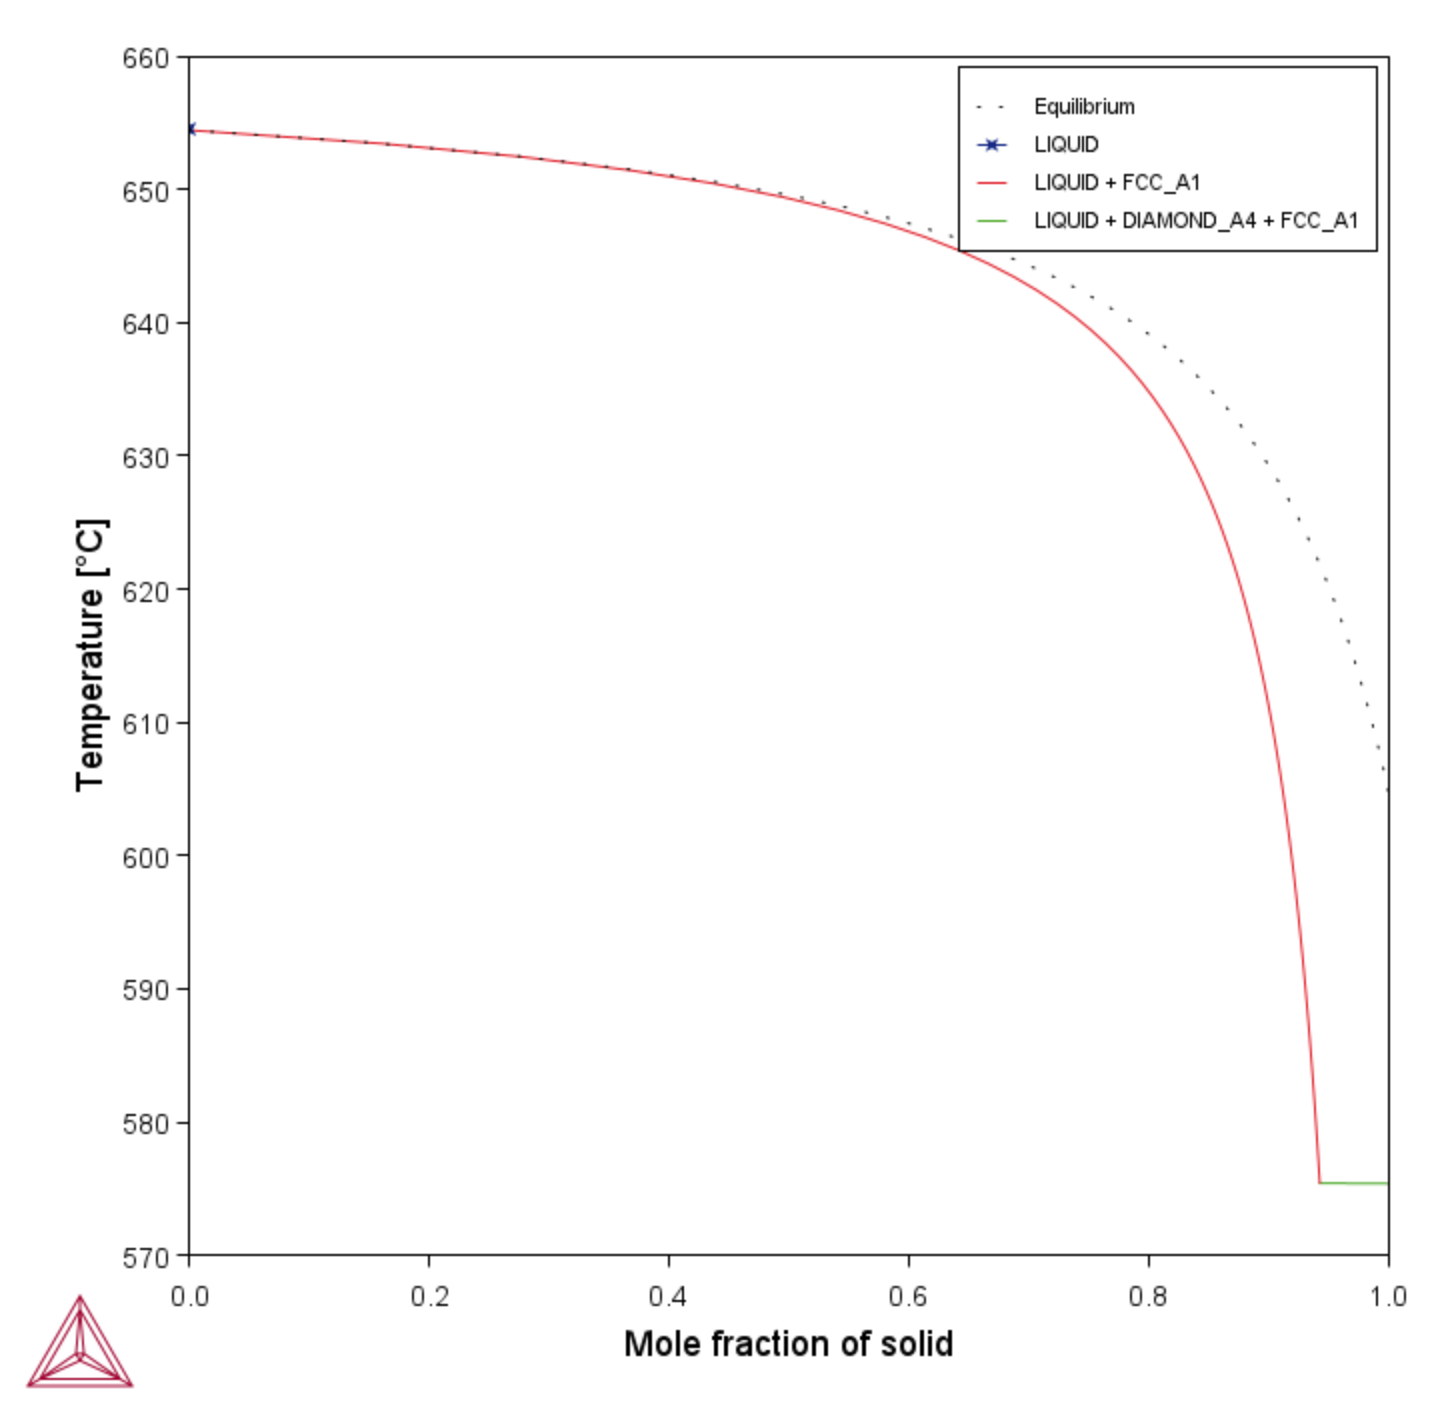
T_08: Scheil and Equilibrium Solidification
This example shows a comparison for an Al-Si alloy solidified under full local equilibrium and under the Scheil assumptions, i.e. zero diffusion in the solidified material and infinitely fast diffusion in the liquid. The example uses the
- Folder: Thermo‑Calc
- File name: T_08_Scheil_and_equilibrium_solidification.tcu
Visualizations
This example is included as a tutorial on our website and as part of the Scheil Solidification Simulations playlist on our YouTube channel.
Open the example project file to review the node setup on the Project window and the associated settings on the Configuration window for each node. For some types of projects, you can also adjust settings on the Plot Renderer Configuration window to preview results before performing the simulation. Click Perform Tree to generate plots and tables to see the results on the Visualizations window.
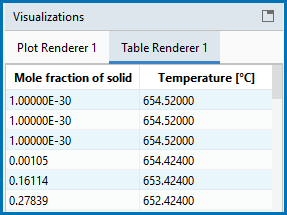
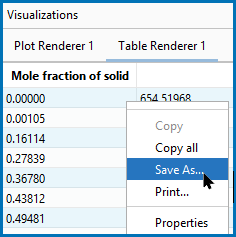
Saving the Table (via Table Renderer)
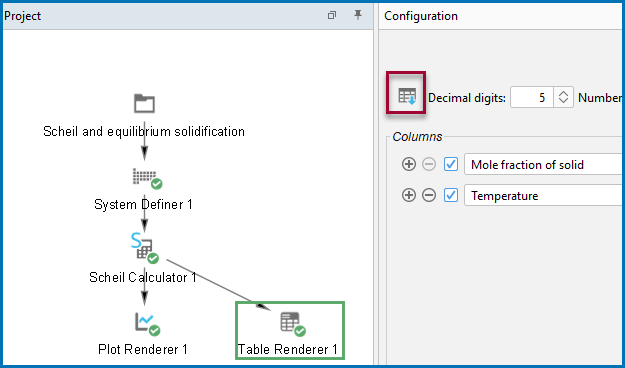
There are different ways to save the table from the Table Renderer Visualizations or Configuration windows.
For the Plot Renderer, there is an option to use the  Table View button to convert plots to table data for all calculation types and calculators.


