AM Plots: Table View Options
There are ways to view AM plot results as a table on either the Configuration or Visualization windows for various plots and calculation types.
2D Plots
For 2D plots (Plot Over Line, Probe, and Thermal Gradient vs Solidification Rate), and once the plot is performed, you can switch between a plot and a table by clicking the Table View button on the Visualizations window.
These plots are available with all calculation types (Steady-state, Transient, and Transient with heat source from Steady-state) simulations.
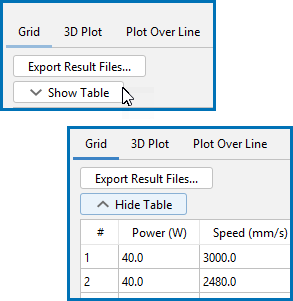
Batch and Grid Plots
For Steady-state Batch and Grid calculations, the available plots Printability map, Meltpool vs energy density, and Parity plot, can also be viewed as a table.
Once the plot is performed, you can toggle to between Show Table and Hide Table on the Configuration window.

