AM Plot Type: Melt Pool vs Energy Density
This topic describes the plot type Melt Pool vs Energy Density which is available with Batch or Grid calculations for a Steady-state simulation.
These examples highlight the use of this plot: AM_08b: Batch Calculations for a Ti64 Alloy and AM_09b: Batch Calculations for an SS316L Alloy.
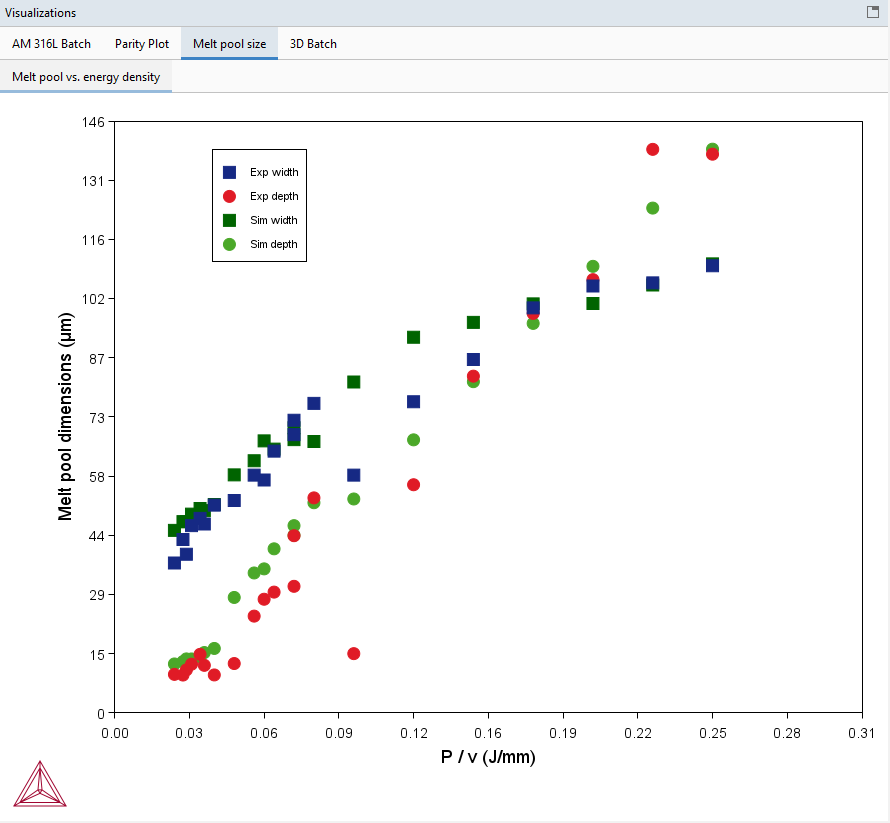
This plot type is used when validating the Steady state Batch calculation against experimentally measured melt pool width and depth. The plot shows the experimental and simulated melt pool dimensions as a function of the energy density (P/v). The plot type can also be used when experimental melt pool dimension are lacking, e.g. after the Grid calculation, but then naturally only shows the simulated melt pool dimensions as a function of the energy density (P/v).
This uses example AM_09b.
Figure 1: Plot comparing experimental versus calculated melt pool dimensions for all the Batch calculations. The experiments are single tracks with SS316L with varied power and scan speed. The melt pool width and depth are shown on the Y-axis and the energy density (P/v) on the X-axis.

