AM Plot Type: Thermal Gradient vs. Solidification Rate
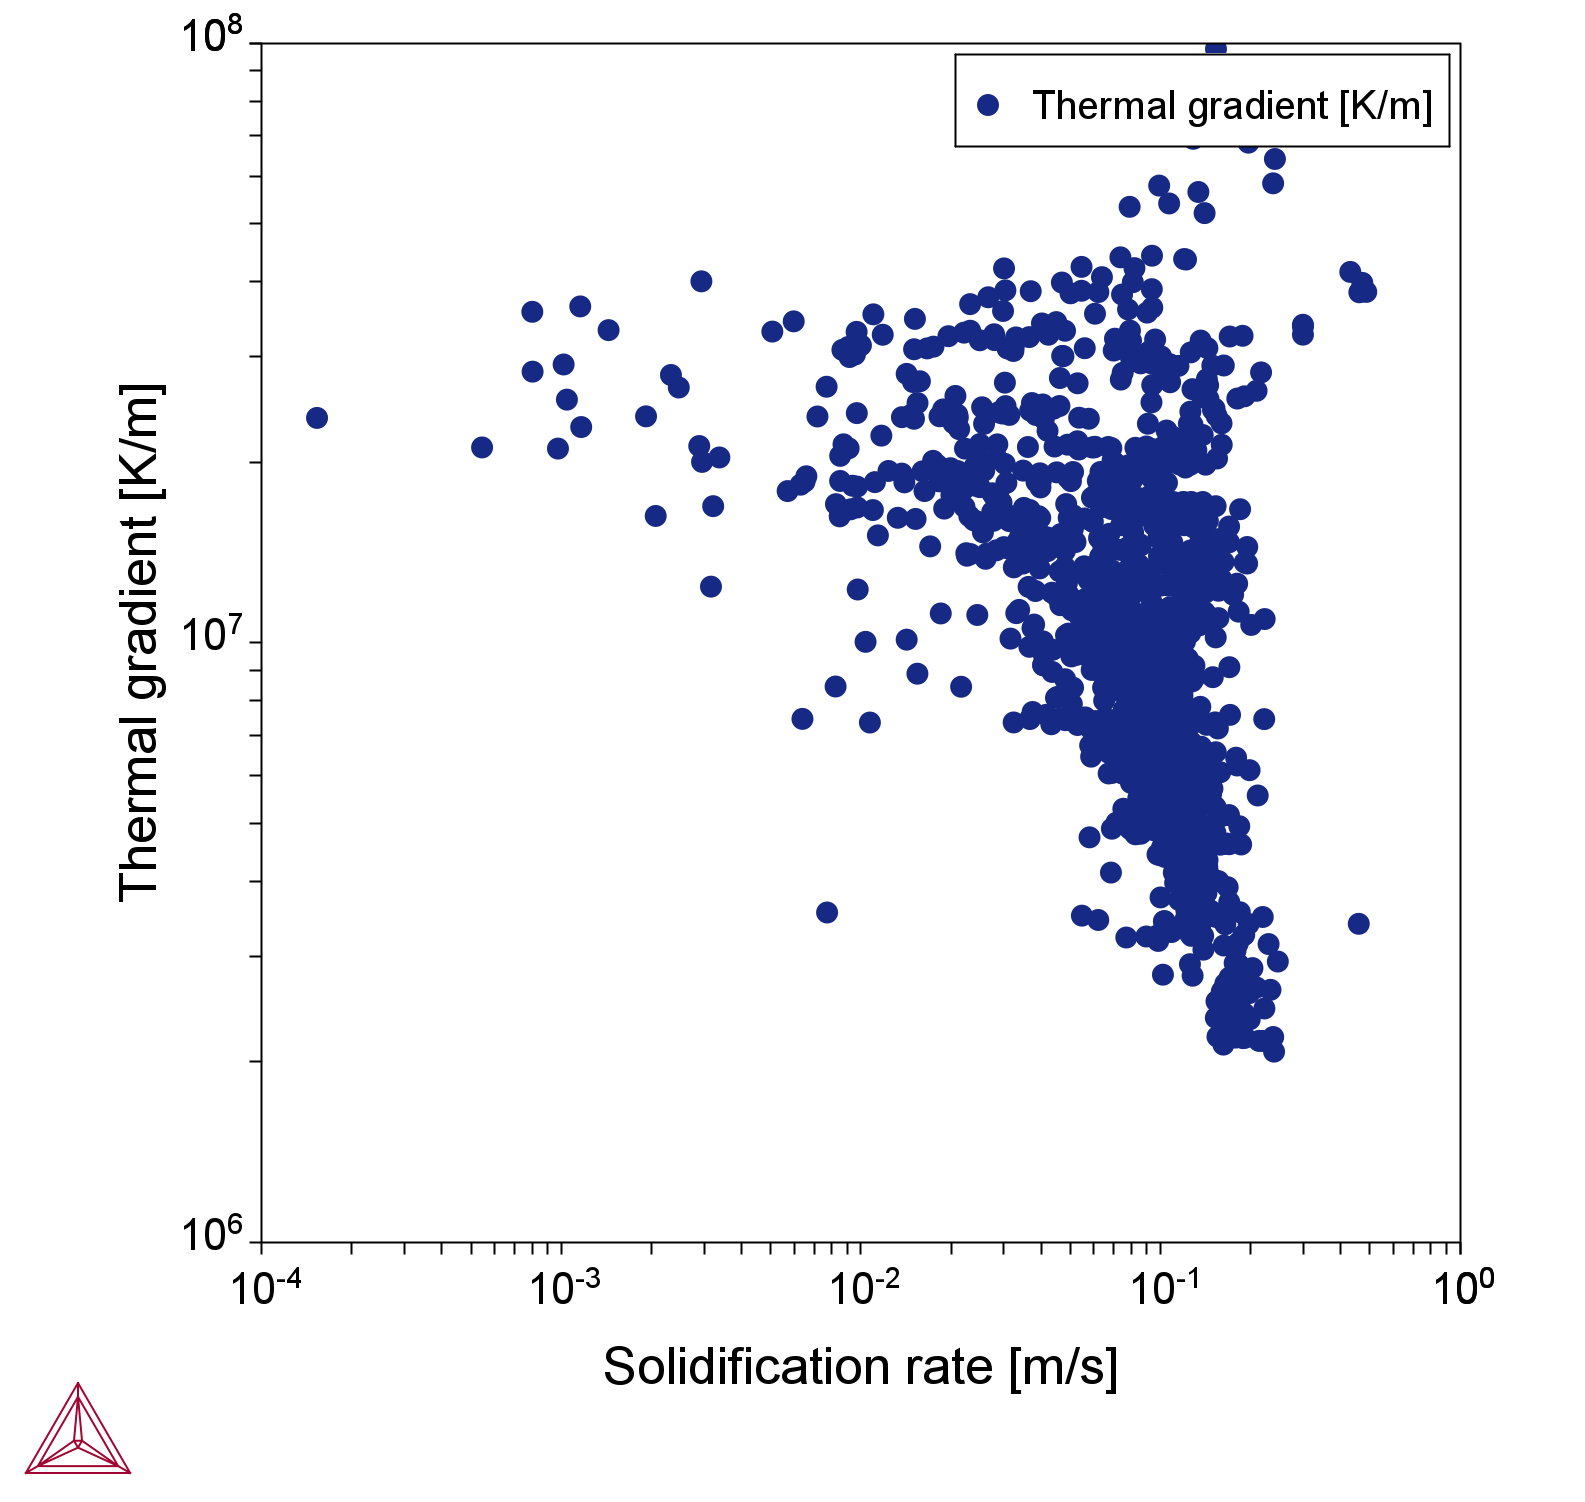
This topic describes 2D and 3D versions of plots comparing thermal gradient to solidification rate along the liquid isotherm. Both the 2D and 3D versions are available for steady-state and transient simulations.
- The 2D version is accessed on the Plot Renderer Configuration window as a tab named Thermal Gradient vs Solidification Rate. It is visualized on a tab of the same name on the Visualizations window.
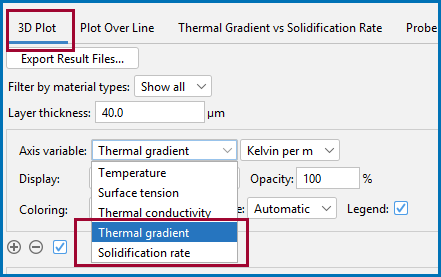
- The 3D version is available on the 3D Plot tab on the Configuration (settings) window. It is further visualized on two 3D Plot tabs on the Visualizations window.
AM_10: CET Transition in an IN718 Alloy includes an example of this plot in both 2D and 3D.
2D Plot
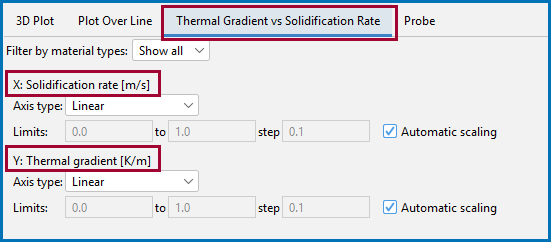
The 2D version of this plot is available on the Thermal Gradient vs Solidification Rate tabs on both the Configuration (settings) and Visualizations window.
You do not need to configure anything on the AM Calculator to access the 2D plot.
On the Thermal Gradient vs Solidification Rate tab on Plot Renderer Configuration window you can adjust the settings for the Solidification rate (X-axis) and Thermal gradient (Y-axis).
As you adjust settings, watch it dynamically change on the Visualizations window. The plot is on the tab of the same name (Thermal Gradient vs Solidification Rate). You can switch between the plot and a table format using the Table View  button.
This uses example AM_10.

Figure 1: The solidification rate vs thermal gradient is shown on the AM Thermal Gradient & Solidification Rate Plot Renderer.
3D Plot
The 3D version of this plot is available on the 3D Plot tab on the Configuration (settings) window. You choose Solidification rate and Thermal gradient as the Axis variable. Use the  and
and  buttons as usual to add and remove quantities.
On the Visualizations window the comparisons for the different calculation types and variable combinations are plotted on two 3D Plot tabs.

