AM Plot Type: Printability Map
This topic describes the plot type Printability Map, which is available with Batch or Grid calculations for a Steady-state simulation. A printability map is also known as a process map.
This plot is available with Batch and Grid calculations. However, using it with the Grid calculation is the preferred method as it provides full coverage of the plot area. Otherwise, if you are doing a Batch calculation and only base it on experimental conditions, it often leaves out the most extreme cases so you get areas in the Printability Map that are blank.
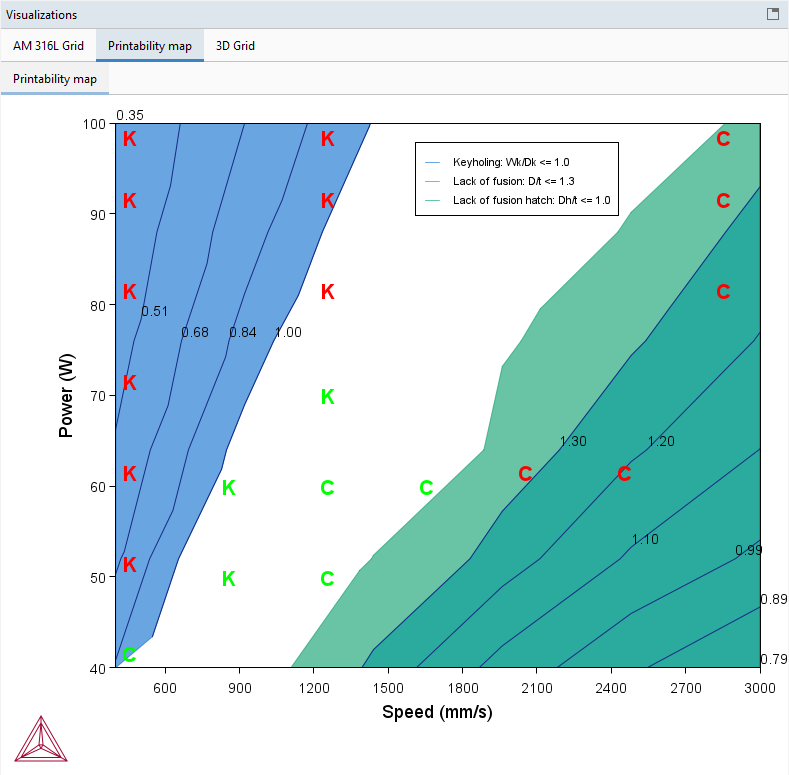
Printability maps allow you to plot the likelihood of three possible defects that occur during additive manufacturing: Keyholing, lack of fusion, and balling.
There is a video tutorial about the Printability Map on our website and on our YouTube channel. It is also included in the Additive Manufacturing Module YouTube playlist.
These examples highlight the use of the printability map: AM_08a: Grid Calculation for a Ti64 Alloy and AM_09a: Grid Calculation for an SS316L Alloy.
These defects occur based on the speed and power used during the AM process. Printability maps allow you to reduce the risks of these defects by showing the speed and power settings that are optimal, which in turn allows you to calibrate your system to avoid these issues.
- Keyholing occurs with low scanning speed and high power.
- Lack of fusion occurs with high scanning speed and low power.
- Balling occurs if you increase the scanning speed.
Figure 1: Printability map for 316L showing regions of keyholing and lack-of-fusion. Experimental information from Hu et. al. [2019Hu] overlaid as coloured labels showing keyhole porosity (K), conduction mode with lack-of-fusion porosity (C). Green labels showing experiments without defects for conduction mode (C) and keyhole mode (K).
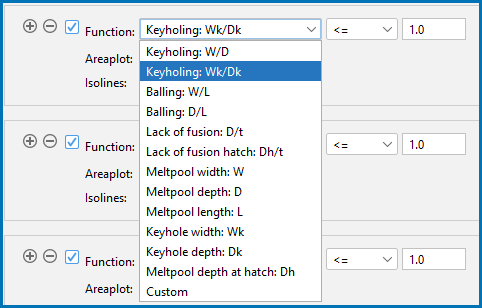
The defect regions in the printability maps are defined by functions of the keyhole dimension (Wk, Dk), melt pool dimensions (W, D, L), hatch distance (h), and powder thickness (t) [2019Joh].
Figure 2: When defining the Printability map on the Plot Renderer for an AM Calculator, you can select from a variety of Functions.
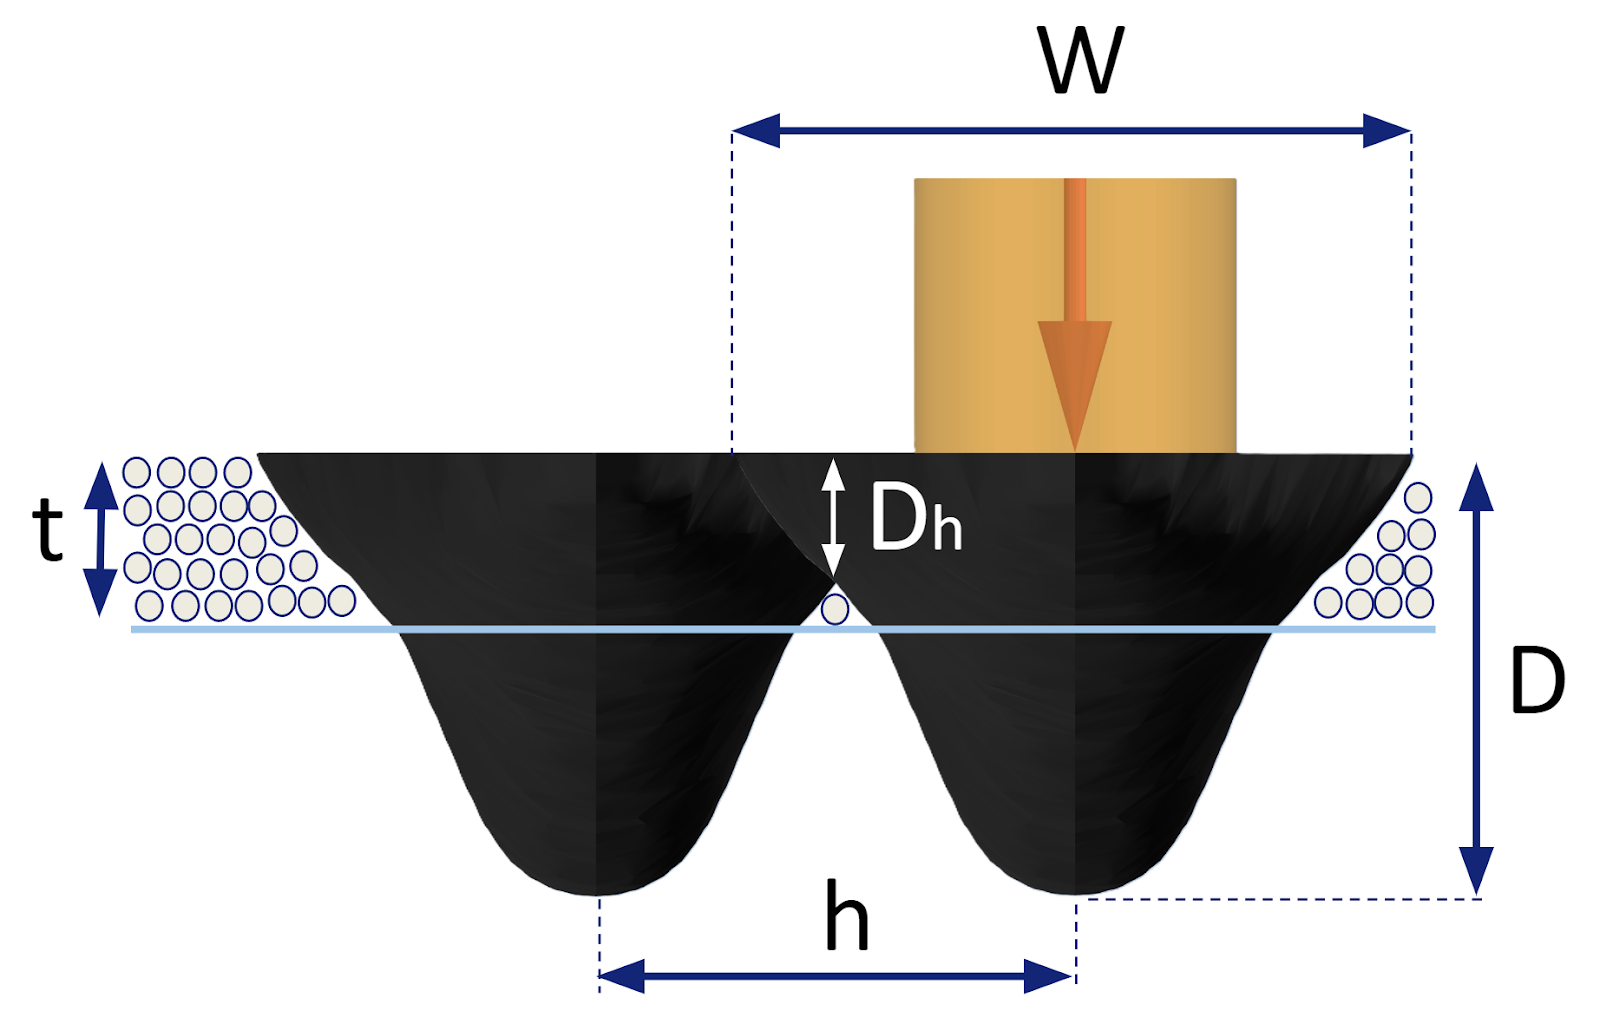
Figure 3: Two single tracks with the melt pool width (W) and depth (D). The hatch distance (h), powder thickness (t), and the melt pool depth at half of the hatch distance (Dh).
Keyholing Porosity
Keyholing is a critical feature in additive manufacturing that occurs at high energy densities (P/v). Keyholing is not only negative, the increased depth of the melt pool can increase productivity. However, deep and narrow keyholes are unstable and can collapse, and lead to keyholing porosity. Keyhole porosity appears close to spherical in shape.
Keyholing porosity can be defined to occur if the width/depth ratio of the keyhole is less than or equal to 1 (i.e. Wk/Dk ≤ 1). Similarly if a volume heat source is used (that lacks information of the keyhole geometry) the ratio of the melt pool (W/D) can be used instead, where W/D ≤ 1.
Lack of Fusion
Lack of fusion porosity occurs if the melt pool, due to low energy density (P/v), fails to penetrate the powder thickness. Lack of fusion gives porosity uneven in shape, compared to keyhole porosity that is close to spherical in shape.
Lack of fusion for a single track can be defined to occur if the melt pool depth is smaller than the powder thickness, i.e. D/t < 1.0. Additionally the lack of fusion between two tracks, at half of the hatch distance, can be defined to occur if Dh/t < 1.0.
Balling
The scan tracks can break up and produce agglomerated particles in spherical shape instead of a single bead. Balling has been defined to occur if ratios W/L [2019Joh] or D/L [2023Kat] are small .
Additional user-defined defect criteria can be defined with the Custom function using any combination of the keyhole dimension (Wk, Dk), melt pool dimensions (W, D, L), hatch distance (h) and powder thickness (t).
References
[2019Hu] Z. Hu, B. Nagarajan, X. Song, R. Huang, W. Zhai, J. Wei, Formation of SS316L Single Tracks in Micro Selective Laser Melting: Surface, Geometry, and Defects. Adv. Mater. Sci. Eng. 2019, 1–9 (2019).
[2019Joh] L. Johnson, M. Mahmoudi, B. Zhang, R. Seede, X. Huang, J. T. Maier, H. J. Maier, I. Karaman, A. Elwany, R. Arróyave, Assessing printability maps in additive manufacturing of metal alloys. Acta Mater. 176, 199–210 (2019).
[2023Kat] J. Katagiri, M. Kusano, S. Minamoto, H. Kitano, K. Daimaru, M. Tsujii, M. Watanabe, Melt Pool Shape Evaluation by Single-Track Experiments and Finite-Element Thermal Analysis: Balling and Lack of Fusion Criteria for Generating Process Window of Inconel738LC. Materials (Basel). 16, 1729 (2023).


